
Ocean Circulation PowerPoint PPT Presentation
Title: Ocean Circulation
1
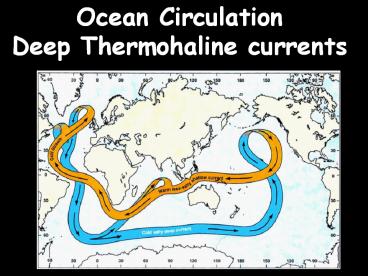
Ocean Circulation Deep Thermohaline currents
2
Density mass/volume (gr/cm3) D (?) (T, S)
3
Density Layered Ocean! Surface layer Ekman
Spiral Pycnocline Layer Geostrophic curr. Deep
Ocean Thermohaline curr.
4
Ocean Circulation
- Surface Circulation ? Wind Driven
- Ekman Transport and Geostrophic Currents
- Surface layer and Picnocline zone
- 0 50,100m / 50,100m - 1000m
- Affects 25 of total water mass
- Fast (1-2 m/s)
5
Surface Geostrophic and Deep Thermohaline
Circulation
6
Ocean Circulation
- Surface Circulation ? Wind Driven
- Ekman Transport and Geostrophic Currents
- Surface layer and Picnocline zone
- 0 50,100m / 50,100m - 1000m
- Affects 25 of total water mass
- Fast (1-2 m/s)
- Deep Circulation ? Density Driven
- Thermohaline Circulation
- Below Picnocline zone (gt1000m)
- Affects 75 of total water mass
- Slow ( m/day)
7
Deep Thermohaline Circulation
- T, S are CONSERVATIVE properties
- TS properties attained at the surface
- Change only by mixing
- (Non-Conservative Properties)
- O2, Nutrients
- Oceans are layered according to water
densities!!!
8
H20 Temperature and Density
9
Seawater Temperature and Density
10
Seawater Ice Formation
11
Seasonal changes of surface layer thermocline
- Surface seasonal thermocline
- Deep permanent thermocline
12
Latitudinal changes of surface layer salinity
13
TS PlotsRepresent the influence of TS on density
(iso-picnolines)
14
TS Plot example
15
Example CTD Hydrographic Survey
16
Example CTD Casts Line A
T
S
D
http//tabs.gerg.tamu.edu/gomoms/ctddata.html
17
Example TS Diagram for CTD Line A
18
Deep Thermohaline Circulation
- So where do Deep Waters Form?
- TS properties attained at the surface
- TS properties remain remarkably constant
- TS properties only altered by water mixing
19
Deep Water Formation
20
Major Water Masses Thermohaline Circulation
- Central Waters (0-1000m)
- Intermediate Waters (1000-2000m)
- Deep Waters (2000-5000m)
- Bottom Waters (over ocean bottom)
21
Atlantic Deep Waters
- AABW
- Antarctic Atlantic Bottom Water
- -1.9 oC - 34.6 o/oo (cold fresh)
- Forms in the Weddell Sea, during southern winter
ice formation - NADW
- North Atlantic Deep Water
- 4 oC - 34.9 o/oo (warm saline)
- Forms by cooling of saline Atlantic surface
waters during northern winters, in the Norwegian
and Greenland Seas
22
Atlantic Deep Waters
- AIW
- Antarctic Intermediate Water
- 2.2 oC - 33.8 o/oo (cold fresh)
- Forms in sub-polar regions, in the Antarctic
Convergence zone - Extends Northward up to 25oN
- (NAIW North Atlantic Intermediate Water)
- MIW
- Mediterranean Intermediate Water
- 11.9 oC - 35.5 o/oo (warm and very saline)
- Spills from Mediterrenan over the Gibraltar Sill
- Forms a tongue in the Atlantic 1000m deep
23
Atlantic Surface Waters
- NACW
- North Atlantic Central Water
- 24 oC - 36 o/oo (very warm very saline)
- Surface waters, low density
24
Atlantic Deep Water Masses
25
Atlantic Deep Water Masses
26
Weddell Sea formation AABW
27
Weddell Sea
28
MediterraneanIntermidiate Water
29
Tracing Deep water masses TS Diagrams
30
Coriolis Effect on Thermohaline Circulation
31
North Atlantic Deep Conveyer belt 1000 year
cycles
32
Conveyor Belt engine
33
North Atlantic Deep Conveyer belt 1000 year
cycles
34
Pacific Ocean Thermohaline Circulation
Recommended
