
Z-Chart PowerPoint PPT Presentation
1 / 1
Title: Z-Chart
1
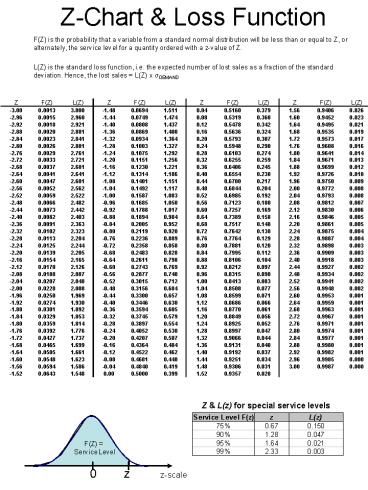
Z-Chart Loss Function
- F(Z) is the probability that a variable from a
standard normal distribution will be less than or
equal to Z, or alternately, the service level for
a quantity ordered with a z-value of Z. - L(Z) is the standard loss function, i.e. the
expected number of lost sales as a fraction of
the standard deviation. Hence, the lost sales
L(Z) x sDEMAND
Z L(z) for special service levels
F(Z) Service Level
0 z z-scale
Z
Recommended
