
Recap - The Gaps model (Zeithaml, Parasuraman & Berry 1990) PowerPoint PPT Presentation
1 / 73
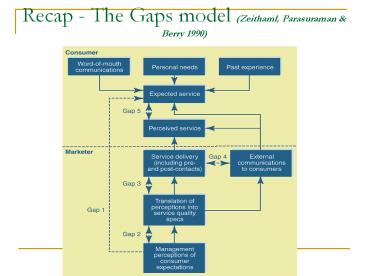
Title: Recap - The Gaps model (Zeithaml, Parasuraman & Berry 1990)
1
Recap - The Gaps model (Zeithaml, Parasuraman
Berry 1990)
2
Recap Stages in Consumer Decision Making and
Evaluation of Services
3
Models of service quality
4
The evolution ofservice quality
- Disconfirmation of expectations
- The Nordic model
- The three component model
- The Gaps model of service quality SERVQUAL
5
Disconfirmation of expectations (Oliver 1980)
6
Frequently Asked QuestionsAbout Customer
Expectations
- Should a company aim to delight the customer?
- How does a company exceed customer service
expectations? - Do customer service expectations continually
escalate? - Is it a better strategy to under-promise and
over-deliver? - How does a service company stay ahead of
competition in meeting customer expectations?
7
The Nordic model (Gronroos 1990)
- Represents the service experience on the basis of
functional and technical elements - Technical quality refers to what the customer
receives from the service - Functional quality refers to service delivery
- Model emphasises companies must be careful what
they promise
8
The three-component model Rust Oliver (1994)
Source Rust Oliver, 1994. p. 11
9
Customer expectations of service
- Types of expectations customers hold for service
performance - Sources of customer expectations
10
Possible Levels of Customer Expectations
11
Dual customer expectations levels and the Zone of
Tolerance
Desired Service
Zone of Tolerance
Adequate Service
12
Zones of Tolerance for DifferentService
Dimensions
Desired Service
Level of Expectation
Desired Service
Zone of Tolerance
Adequate Service
Reliability
Tangibles
Source L. L. Berry, A. Parasuraman, and V. A.
Zeithaml, Ten Lessons for Improving Service
Quality, Marketing Science Institute, Report No.
93-104 (May 1993).
13
Factors That Influence Desired Service
Lasting Service Intensifiers
Desired Service
Personal Needs
Zone of Tolerance
Adequate Service
14
Factors That Influence Adequate Service
Temporary Service Intensifiers
Desired Service
Perceived Service Alternatives
Zone of Tolerance
Self-Perceived Service Role
Predicted Service
Adequate Service
Situational Factors
15
Factors That Influence Desired and Predicted
Service
Explicit Service Promises
Implicit Service Promises
Word-of-Mouth
Desired Service
Zone of Tolerance
Past Experience
Predicted Service
Adequate Service
16
Customer perceptions
- Factors which influence consumers perceptions
- Factors which influence satisfaction
- Dimensions of service quality
- Service encounters
17
Customer Perceptions of Quality and Customer
Satisfaction
18
Factors Influencing Customer Satisfaction
- Product/service quality
- Specific product or service features
- Consumer emotions
- Attributions for service success or failure
19
Factors Influencing Customer Satisfaction
- Perceptions of equity or fairness
- Other consumers, family members, and coworkers
- Price
- Personal factors
- the customers mood or emotional state
- situational factors
20
Outcomes of Customer Satisfaction
- Increased customer retention
- Positive word-of-mouth communications
- Increased revenues
21
ASCI and Annual Percentage Growthin SP 500
Earnings
Source C. Fornell Customer Satisfaction and
Corporate Earnings, commentary appearing on ACSI
website, May 1, 2001, http//www.bus.umich.edu/res
earch/nqre/Q1-01c.html.
22
Relationship between Customer Satisfaction and
Loyalty in Competitive Industries
Source James L. Heskett, W. Earl Sasser, Jr.,
and Leonard A. Schlesinger, The Service Profit
Chain, (New York, NY The Free Press, 1997), p.
83.
23
Service Quality
- The customers judgment of overall excellence of
the service provided in relation to the quality
that was expected. - Service quality assessments are formed on
judgments of - outcome quality
- interaction quality
- physical environment quality
24
The SERVQUAL dimensions Perceived Service
Quality (Parasuraman, Zeithaml Berry 1988)
- Reliability (dependability, accurate performance)
- Assurance (competence, courtesy, credibility
security) - Tangibles (appearance of physical elements)
- Empathy (easy access, good communications
customer understanding) - Responsiveness (promptness helpfulness)
25
The Five Dimensions of Service Quality
- Ability to perform the promised service
dependably and accurately. - Knowledge and courtesy of employees and their
ability to inspire trust and confidence. - Physical facilities, equipment, and appearance of
personnel. - Caring, individualized attention the firm
provides its customers. - Willingness to help customers and provide prompt
service.
Reliability
Assurance
Tangibles
Empathy
Responsiveness
26
Exercise to Identify Service Attributes
In groups of five, choose a services industry and
spend 10 minutes brainstorming specific
requirements of customers in each of the five
service quality dimensions. Be certain the
requirements reflect the customers point of
view.
Reliability Assurance Tangibles Empathy Re
sponsiveness
27
SERVQUAL Attributes
RELIABILITY
- Providing service as promised
- Dependability in handling customers service
problems - Performing services right the first time
- Providing services at the promised time
- Maintaining error-free records
EMPATHY
- Giving customers individual attention
- Employees who deal with customers in a caring
fashion - Having the customers best interest at heart
- Employees who understand the needs of their
customers - Convenient business hours
RESPONSIVENESS
- Keeping customers informed as to when services
will be performed - Prompt service to customers
- Willingness to help customers
- Readiness to respond to customers requests
TANGIBLES
- Modern equipment
- Visually appealing facilities
- Employees who have a neat, professional
appearance - Visually appealing materials associated with the
service
ASSURANCE
- Employees who instill confidence in customers
- Making customers feel safe in their transactions
- Employees who are consistently courteous
- Employees who have the knowledge to answer
customer questions
28
The Service Encounter
- is the moment of truth
- occurs any time the customer interacts with the
firm - can potentially be critical in determining
customer satisfaction and loyalty - types of encounters
- remote encounters, phone encounters, face-to-face
encounters - is an opportunity to
- build trust
- reinforce quality
- build brand identity
- increase loyalty
29
A Service Encounter Cascadefor a Hotel Visit
Check-In
Bellboy Takes to Room
Restaurant Meal
Request Wake-Up Call
Checkout
30
A Service Encounter Cascade for an Industrial
Purchase
Sales Call
Delivery and Installation
Servicing
Ordering Supplies
Billing
31
Critical Service Encounters Research
- GOAL
- understanding actual events and behaviors that
cause customer dis/satisfaction in service
encounters - METHOD
- Critical Incident Technique
- DATA
- stories from customers and employees
- OUTPUT
- identification of themes underlying satisfaction
and dissatisfaction with service encounters
32
Sample Questions for Critical Incidents Technique
Study
- Think of a time when, as a customer, you had a
particularly satisfying (dissatisfying)
interaction with an employee of ______________. - When did the incident happen?
- What specific circumstances led up to this
situation? - Exactly what was said and done?
- What resulted that made you feel the interaction
was satisfying (dissatisfying)?
33
Common Themes in CriticalService Encounters
Research
Recovery
Adaptability
employee response to service delivery system
failure
employee response to customer needs and requests
Spontaneity
Coping
unprompted and unsolicited employee actions and
attitudes
employee response to problem customers
34
Recovery
DO
DONT
- Acknowledge problem
- Explain causes
- Apologize
- Compensate/upgrade
- Lay out options
- Take responsibility
- Ignore customer
- Blame customer
- Leave customer to fend for him/herself
- Downgrade
- Act as if nothing is wrong
- Pass the buck
35
Adaptability
DO
DONT
- Recognize the seriousness of the need
- Acknowledge
- Anticipate
- Attempt to accommodate
- Adjust the system
- Explain rules/policies
- Take responsibility
- Ignore
- Promise, but fail to follow through
- Show unwillingness to try
- Embarrass the customer
- Laugh at the customer
- Avoid responsibility
- Pass the buck
36
Spontaneity
DO
DONT
- Take time
- Be attentive
- Anticipate needs
- Listen
- Provide information
- Show empathy
- Exhibit impatience
- Ignore
- Yell/laugh/swear
- Steal from customers
- Discriminate
37
Coping
DO
DONT
- Listen
- Try to accommodate
- Explain
- Let go of the customer
- Take customers dissatisfaction personally
- Let customers dissatisfaction affect others
38
Evidence of Service from theCustomers Point of
View
- Contact employees
- Customer him/herself
- Other customers
- Operational flow of activities
- Steps in process
- Flexibility vs. standard
- Technology vs. human
People
Physical Evidence
- Tangible communication
- Servicescape
- Guarantees
- Technology
- Website
Process
Source From Managing the Evidence of Service
by M. J. Bitner from The Service Quality
Handbook, eds. E. E. Scheuing and W. F.
Christopher (1993), pp. 358-70.
39
Customer perceptions of service
40
Customer Perceptions of Service
- Influences on customer perceptions of service and
the relationships among customer satisfaction,
service quality, and individual service
encounters. - Importance of customer satisfactionwhat it is,
the factors that influence it, and the
significant outcomes resulting from it. - Service quality and its five key dimensions
reliability, responsiveness, empathy, assurance,
and tangibles. - Service encounters or moments of truth are the
essential building blocks from which customers
form their perceptions.
41
Customer Perceptions of Quality and Customer
Satisfaction
42
Factors Influencing Customer Satisfaction
- Product/service quality
- Specific product or service features
- Consumer emotions
- Attributions for service success or failure
- Perceptions of equity or fairness
- Other consumers, family members, and coworkers
- Price
- Personal factors
- the customers mood or emotional state
- situational factors
43
Outcomes of Customer Satisfaction
- Increased customer retention
- Positive word-of-mouth communications
- Increased revenues
44
ASCI and Annual Percentage Growthin SP 500
Earnings
Source C. Fornell Customer Satisfaction and
Corporate Earnings, commentary appearing on ACSI
website, May 1, 2001, http//www.bus.umich.edu/res
earch/nqre/Q1-01c.html.
45
Relationship between Customer Satisfaction and
Loyalty in Competitive Industries
Source James L. Heskett, W. Earl Sasser, Jr.,
and Leonard A. Schlesinger, The Service Profit
Chain, (New York, NY The Free Press, 1997), p.
83.
46
Service Quality
- The customers judgment of overall excellence of
the service provided in relation to the quality
that was expected. - Service quality assessments are formed on
judgments of - outcome quality
- interaction quality
- physical environment quality
47
The Five Dimensions of Service Quality
- Ability to perform the promised service
dependably and accurately. - Knowledge and courtesy of employees and their
ability to inspire trust and confidence. - Physical facilities, equipment, and appearance of
personnel. - Caring, individualized attention the firm
provides its customers. - Willingness to help customers and provide prompt
service.
Reliability
Assurance
Tangibles
Empathy
Responsiveness
48
Exercise to Identify Service Attributes
In groups of five, choose a services industry and
spend 10 minutes brainstorming specific
requirements of customers in each of the five
service quality dimensions. Be certain the
requirements reflect the customers point of
view.
Reliability Assurance Tangibles Empathy Re
sponsiveness
49
SERVQUAL Attributes
RELIABILITY
EMPATHY
- Giving customers individual attention
- Employees who deal with customers in a caring
fashion - Having the customers best interest at heart
- Employees who understand the needs of their
customers - Convenient business hours
- Providing service as promised
- Dependability in handling customers service
problems - Performing services right the first time
- Providing services at the promised time
- Maintaining error-free records
RESPONSIVENESS
TANGIBLES
- Keeping customers informed as to when services
will be performed - Prompt service to customers
- Willingness to help customers
- Readiness to respond to customers requests
- Modern equipment
- Visually appealing facilities
- Employees who have a neat, professional
appearance - Visually appealing materials associated with the
service
ASSURANCE
- Employees who instill confidence in customers
- Making customers feel safe in their transactions
- Employees who are consistently courteous
- Employees who have the knowledge to answer
customer questions
50
The Service Encounter
- is the moment of truth
- occurs any time the customer interacts with the
firm - can potentially be critical in determining
customer satisfaction and loyalty - types of encounters
- remote encounters, phone encounters, face-to-face
encounters - is an opportunity to
- build trust
- reinforce quality
- build brand identity
- increase loyalty
51
A Service Encounter Cascadefor a Hotel Visit
Check-In
Bellboy Takes to Room
Restaurant Meal
Request Wake-Up Call
Checkout
52
A Service Encounter Cascade for an Industrial
Purchase
Sales Call
Delivery and Installation
Servicing
Ordering Supplies
Billing
53
Critical Service Encounters Research
- GOAL
- understanding actual events and behaviors that
cause customer dis/satisfaction in service
encounters - METHOD
- Critical Incident Technique
- DATA
- stories from customers and employees
- OUTPUT
- identification of themes underlying satisfaction
and dissatisfaction with service encounters
54
Sample Questions for Critical Incidents Technique
Study
- Think of a time when, as a customer, you had a
particularly satisfying (dissatisfying)
interaction with an employee of ______________. - When did the incident happen?
- What specific circumstances led up to this
situation? - Exactly what was said and done?
- What resulted that made you feel the interaction
was satisfying (dissatisfying)?
55
Common Themes in CriticalService Encounters
Research
Recovery
Adaptability
employee response to service delivery system
failure
employee response to customer needs and requests
Spontaneity
Coping
unprompted and unsolicited employee actions and
attitudes
employee response to problem customers
56
Recovery
DO
DONT
- Acknowledge problem
- Explain causes
- Apologize
- Compensate/upgrade
- Lay out options
- Take responsibility
- Ignore customer
- Blame customer
- Leave customer to fend for him/herself
- Downgrade
- Act as if nothing is wrong
- Pass the buck
57
Adaptability
DO
DONT
- Recognize the seriousness of the need
- Acknowledge
- Anticipate
- Attempt to accommodate
- Adjust the system
- Explain rules/policies
- Take responsibility
- Ignore
- Promise, but fail to follow through
- Show unwillingness to try
- Embarrass the customer
- Laugh at the customer
- Avoid responsibility
- Pass the buck
58
Spontaneity
DO
DONT
- Take time
- Be attentive
- Anticipate needs
- Listen
- Provide information
- Show empathy
- Exhibit impatience
- Ignore
- Yell/laugh/swear
- Steal from customers
- Discriminate
59
Coping
DO
DONT
- Listen
- Try to accommodate
- Explain
- Let go of the customer
- Take customers dissatisfaction personally
- Let customers dissatisfaction affect others
60
Evidence of Service from theCustomers Point of
View
- Contact employees
- Customer him/herself
- Other customers
- Operational flow of activities
- Steps in process
- Flexibility vs. standard
- Technology vs. human
People
Physical Evidence
- Tangible communication
- Servicescape
- Guarantees
- Technology
- Website
Process
Source From Managing the Evidence of Service
by M. J. Bitner from The Service Quality
Handbook, eds. E. E. Scheuing and W. F.
Christopher (1993), pp. 358-70.
61
(No Transcript)
62
Part 3
UNDERSTANDING CUSTOMER REQUIREMENTS
63
Provider Gap 1
CUSTOMER
Expected Service
Listening Gap
COMPANY
Company Perceptions of Consumer Expectations
Part 3 Opener
64
Listening to customers through market research
- Using Marketing Research to Understand Customer
Expectations - Elements in an Effective Services Marketing
Research Program - Analyzing and Interpreting Marketing Research
Findings - Model Services Marketing Research Programs
- Using Marketing Research Information
- Upward Communication
65
Objectives for Chapter 6Listening to Customers
through Research
- Present the types of and guidelines for marketing
research in services. - Show how marketing research information can and
should be used for services. - Describe the strategies by which companies can
facilitate interaction and communication between
management and customers. - Present ways that companies can and do facilitate
interaction between contact people and management.
66
Common Research Objectives for Services
- To discover customer requirements or expectations
for service. - To monitor and track service performance.
- To assess overall company performance compared
with that of competition. - To assess gaps between customer expectations and
perceptions. - To identify dissatisfied customers, so that
service recovery can be attempted. - To gauge effectiveness of changes in service
delivery. - To appraise the service performance of
individuals and teams for evaluation,
recognition, and rewards. - To determine customer expectations for a new
service. - To monitor changing customer expectations in an
industry. - To forecast future expectations of customers.
67
Criteria for an EffectiveService Research Program
- Includes both qualitative and quantitative
research - Includes both expectations and perceptions of
customers - Balances the cost of the research and the value
of the information - Includes statistical validity when necessary
- Measures priorities or importance of attributes
- Occurs with appropriate frequency
- Includes measures of loyalty, behavioral
intentions, or actual behavior
68
Stages in the Research Process
- Stage 1 Define Problem
- Stage 2 Develop Measurement Strategy
- Stage 3 Implement Research Program
- Stage 4 Collect and Tabulate Data
- Stage 5 Interpret and Analyze Findings
- Stage 6 Report Findings
69
Portfolio of Services Research
Research Objective
Type of Research
Identify dissatisfied customers to attempt
recovery identify most common categories of
service failure for remedial action
Customer Complaint Solicitation Relationship
Surveys Post-Transaction Surveys Customer Focus
Groups Mystery Shopping of Service
Providers Employee Surveys
Assess companys service performance compared to
competitors identify service-improvement
priorities track service improvement over time
Obtain customer feedback while service experience
is fresh act on feedback quickly if negative
patterns develop
Use as input for quantitative surveys provide a
forum for customers to suggest service-improvement
ideas
Measure individual employee service behaviors for
use in coaching, training, performance
evaluation, recognition and rewards identify
systemic strengths and weaknesses in service
Measure internal service quality identify
employee-perceived obstacles to improve service
track employee morale and attitudes
Lost Customer Research Future Expectations
Research
Determine the reasons why customers defect
Forecast future expectations of customers
develop and test new service ideas
70
Figure 6.3Tracking of Customer Expectations and
Perceptions of Service Reliability
Source E. Sivadas, Europeans Have a Different
Take on CS Customer Satisfaction Programs,
Marketing News, October 26, 1998, p. 39.
71
Figure 6.4Service Quality Perceptions Relative
to Zones of Tolerance
9 8 7 6 5 4 3 2 1 0
O
O
O
O
O
Reliability Responsiveness Assurance
Empathy Tangibles
O
Zone of Tolerance Service
Quality Perception
Retail Chain
72
Service Quality Perceptions Relative to Zones of
Tolerance
10 8 6 4 2 0
O
O
O
O
O
Reliability Responsiveness
Assurance Empathy Tangibles
Computer Manufacturer
O
Zone of Tolerance S.Q. Perception
73
Figure 6.5 Importance/Performance Matrix
HIGH
High Leverage
?
?
Attributes to Improve
Attributes to Maintain
?
?
?
?
?
Importance
Low Leverage
?
Low Leverage
?
?
Attributes to De-emphasize
Attributes to Maintain
Performance
HIGH
LOW
Recommended
