
Physical Methods In Bioinorganic Chemistry PowerPoint PPT Presentation
1 / 48
Title: Physical Methods In Bioinorganic Chemistry
1
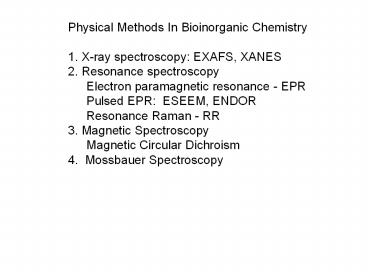
Physical Methods In Bioinorganic Chemistry 1.
X-ray spectroscopy EXAFS, XANES 2. Resonance
spectroscopy Electron paramagnetic resonance -
EPR Pulsed EPR ESEEM, ENDOR Resonance Raman -
RR 3. Magnetic Spectroscopy Magnetic Circular
Dichroism 4. Mossbauer Spectroscopy
2
- Physical Methods In Bioinorganic Chemistry
- X-ray spectroscopy EXAFS, XANES
- Gives M-L distances to high precision
- Gives identities and numbers of M and L
- Gives some information on geometry
- No info on angles, conformations
- Resonance spectroscopy
- Electron paramagnetic resonance - EPR
- Pulsed EPR ESEEM, ENDOR
- Resonance Raman - RR
- 3. Magnetic Spectroscopy
- Magnetic Circular Dichroism
- 4. Mossbauer Spectroscopy
3
Physical Methods In Bioinorganic Chemistry 1.
X-ray spectroscopy EXAFS, XANES 2. Resonance
spectroscopy Electron paramagnetic resonance -
EPR Gives info on metal identity, donor atoms,
and 2nd sphere atoms Some info on bonding
character Pulsed EPR ESEEM, ENDOR Resonance
Raman - RR 3. Magnetic Spectroscopy Magnetic
Circular Dichroism 4. Mossbauer Spectroscopy
4
Physical Methods In Bioinorganic Chemistry 1.
X-ray spectroscopy EXAFS, XANES 2. Resonance
spectroscopy Electron paramagnetic resonance -
EPR Pulsed EPR ESEEM, ENDOR Resonance Raman -
RR Gives info on vibrations and bond
order Reveals coupled electronic and vibrational
states 3. Magnetic Spectroscopy Magnetic
Circular Dichroism 4. Mossbauer Spectroscopy
5
Physical Methods In Bioinorganic Chemistry 1.
X-ray spectroscopy EXAFS, XANES 2. Resonance
spectroscopy Electron paramagnetic resonance -
EPR Pulsed EPR ESEEM, ENDOR Resonance Raman -
RR 3. Magnetic Spectroscopy Magnetic Circular
Dichroism Correlates e- transitions and MOs by
symmetry 4. Mossbauer Spectroscopy
6
Physical Methods In Bioinorganic Chemistry 1.
X-ray spectroscopy EXAFS, XANES 2. Resonance
spectroscopy Electron paramagnetic resonance -
EPR Pulsed EPR ESEEM, ENDOR Resonance Raman -
RR 3. Magnetic Spectroscopy Magnetic Circular
Dichroism 4. Mossbauer Spectroscopy Gives
oxidation state of Fe ions
Usefulness? Inorganic Chemistry Vol. 44, No. 4
February 21, 2005"Functional Insight from
Physical Methods on Metalloenzymes" Edward I.
Solomon pp 723 - 726
7
XAS techniques Get your bearings in energy
8
- Physical Methods In Bioinorganic Chemistry
- X-ray spectroscopy EXAFS, XANES
- Resonance spectroscopy
- Electron paramagnetic resonance - EPR
- Pulsed EPR ESEEM, ENDOR
- Resonance Raman - RR
- Magnetic Spectroscopy
- Magnetic Circular Dichroism
- Mossbauer Spectroscopy
- Gives oxidation state of Fe ions
Usefulness? Inorganic Chemistry Vol. 44, (2005)
pp 723 - 726 "Functional Insight from Physical
Methods on Metalloenzymes" Edward I. Solomon -
Stanford University
9
X-RAY ABSORPTION SPECTROSCOPY XAS, EXAFS,
XANES When an atom is bombarded by X-rays
- an electron from a core level is excited to the
unoccupied states of the system - changing the
X-ray excitation energy changes the unoccupied
state the electron can reach - EXAFS extended
X-ray absorption Fine Structures - XANES X-ray
Absorption Near Edge Structure
10
When a photoelectron is ejected
EXAFS Ripples from interference of neighbors
Energy needed to eject core electron
Considering the wave nature of the ejected
photoelectron and regarding the atoms as point
scatterers a simple picture can be seen in which
the backscattered waves interfere with the
forward wave to produce either peaks or troughs.
RAWDATA http//www.haverford.edu/chem/Scarrow/EXAF
S123/Plotting20Graphs.htm FITTING
http//www.haverford.edu/chem/Scarrow/EXAFS123/FIT
TING.htm REFINING http//www.haverford.edu/chem/Sc
arrow/EXAFS123/REFINING.htm
11
Cant do this at home requires an intense X-ray
source -gt Synchrotron Radiation
1. SSRL Stanford Synchrotron Radiation Lab The
Stanford Synchrotron Radiation Laboratory, a
division of Stanford Linear Accelerator Center,
is operated by Stanford University for the
Department of Energy. SSRL is a National User
Facility which provides synchrotron radiation, a
name given to x-rays or light produced by
electrons circulating in a storage ring at nearly
the speed of light. These extremely bright x-rays
can be used to investigate various forms of
matter ranging from objects of atomic and
molecular size to man-made materials with unusual
properties. The obtained information and
knowledge is of great value to society, with
impact in areas such as the environment, future
technologies, health, and education.
2. Advanced Photon Source - The Advanced Photon
Source at Argonne National Laboratory is a
national synchrotron-radiation light source
research facility funded by the U.S. Department
of Energy, Office of Science, Office of Basic
Energy Sciences. Using high-brilliance x-ray
beams, well over 3000 individual users conducted
research at the APS. When all 70 beamlines are
operational, that number is expected to grow to
more than 4000 annually.
12
Mn-O 1.4 Å
Mn-O 2.2 Å
Various Intramoecular Distances in the Tetra-Mn
cluster of Photosystem II, the O2 evolving
center in Photosynthesis, as seen by EXAFS.
Mn-Mn 3.0 Å
Mn-Ca 3.0 Å
13
The K-edge XANES spectrum measured at 10K and low
X-ray dose for intact PSII samples (A) is similar
to corresponding edges for dimeric Mn(IV,IV) or
Mn(III,III) model complexes (B). After exposure
to various doses of x-rays under
crystallographic conditions the edge energy is
shifting to lower energies and the edge shape
transforms into that observed for Mn2 in
solution (compare A and B). The EXAFS
measurements in panel C show that this reduction
process severely affects the integrity of the
Mn4OxCa cluster. The blue top trace shows the FT
spectrum of the intact cluster. The second FT
peak, which reflects the bis oxo bridged Mn-Mn
interactions at 2.7-2.8 Å is already reduced
significantly after reduction of 25 Mn to Mn2
(green trace). Concomitantly the first peak moves
to longer distances reflecting the conversion of
µ-oxo bridges into terminal water ligands. The
red trace reflects the structure of the Mn4OxCa
complex at the average reduction level of 70
that is reached during crystallographic
experiments
XANES
EXAFS
Dr. Johannes Messinger, MPI für Bioanorganische
Chemie, Mülheim an der Ruhr http//ewww.mpi-muelhe
im.mpg.de/bac/mitarbeiter/messinger/messinger_en.p
hp
14
XANES simulations of the CuSMo active site in
CO dehydrogenase Most of the structural
information derived by XAS is obtained from the
oscillatory high-energy part of a XAS spectrum
(EXAFS). However, the structural details obtained
are in most cases limited to radial models
because the EXAFS signal is dominated by single
scattering processes of the photoelectron after
the X-ray absorption. In contrast, for the
absorption edge region of the spectrum (XANES)
multiple scattering events are very important and
they depend on the 3D arrangement of the atoms
around the excited atom. Using the program FEFF8,
I performed an extensive Mo- and Cu-K-edge XANES
analysis for various forms of the metalloenzyme
CODH (unpublished data). Research of Manuel
Gnida Department of Pediatrics Stanford
University School of Medicine
15
EXAFS data for Tyrosinase Biochimica et
Biophysica Acta (BBA) - Protein Structure and
Molecular Enzymology Volume 788, Issue 2, 31 July
1984, Pages 155-161
16
Electron Paramagnetic Resonance
(EPR) or Electron Spin Resonance (ESR)
a Ms 1/2
DE g mb B where the g-value gives
characteristic info. DE is microwave region
a
b
b Ms -1/2, antiparallel to B more stable
No magnetic field B 0
Magnetic field B ? 0
17
- Resonance Measurement
- EPR spectrometer is
- constant frequency
- X-band 9-10 Giga Hertz (GHz)
- Q-band (high field) 35 GHz
- vary B field (3500 Gauss)
- to bring into resonance
- DE is absorbed by the sample when the frequency
of the radiation is appropriate to the energy
difference between two states of the electrons in
the sample - (10,000 Gauss 1 Tesla)
18
Interpreting EPR.1 The Derivative Signal
19
Interpreting EPR.2 (Nuclear) Hyperfine Coupling
. CH3 radical e- localized on C Hyperfine coupled
to 3H (quartet)
AH
. CH2(OCH3) radical e- localized on C Larger
hyperfine (AH) coupled to 2H (triplet) and
smaller hyperfine (AH) to 3H (quartet)
AH
AH
20
Interpreting EPR.3 Isotropic vs Anisotropic
Spectra Depends on sample type - liquid
solution room temp - frozen solution - powder
- single crystal (oriented) Depends on
symmetry around metal ion
giso
g
g?
gyy
gxx
gzz
The EPR spin Hamiltonian operator with x,y,z
tensors
21
Mo EPR Spectroscopy The First Spectroscopic
Technique Characterizing the Mo site in Enzymes
Mix of Isotopes 92Mo 15 94Mo 9 95Mo
16 95Mo 17 97Mo 9 98Mo 24 100Mo 10 92Mo,
94Mo, 96Mo, 98Mo and 100Mo have I 0, give one
hyperfine signal 95Mo and 97Mo (total 25) have
I 5/2, give six hyperfine signals with
A(95,97Mo)
Isotropic Mo EPR spectrum
22
(a) EPR spectra of LMoO(bdt) experimental
frozen-solution X-band spectrum (top) and
simulated spectrum (I 0 component only, bottom).
EPR Spectra of Model Complexes. The EPR spectrum
of LMoVO(bdt) (1) exhibits a rhombic g tensor and
an unusual A(95,97Mo) matrix that consists of two
large components (A1 A3) at the extremes of the
spectrum and one small component in the center,
as shown in Figure 4 and Table 4. The point group
symmetry of a metal complex determines which
metal d orbitals are allowed to intermix. Such
intermixing will determine whether or not the
principal axes of the g and A(95,97Mo) tensors
coincide. Complexes with no symmetry elements
(C1) or with an inversion center (Ci) are not
required to have any of the principal g and
A(95,97Mo) axes coincident, whereas complexes
with C2, Cs, or C2h point group symmetry are
required to have one of the principal g and
A(95,97Mo) axes coincident.38-40 In the case of
oxo-molybdenum(V) complexes of the type LMoOX2,
which closely approximate Cs symmetry, an Euler
angle (30-40) for the rotation of the g- and
A(95,97Mo) )-tensor elements has typically been
observed.38 An unusual feature of 1 is that the g
and A tensors are nearly coincident in this
low-symmetry (Cs) complex, where such coincidence
between principal g and A(95,97Mo) ) tensors is
not required.
(b) EPR spectra of LMoO(bdt) experimental
frozen-solution (top) and simulated spectrum (I
5/2 component only, bottom).
(c) EPR spectra of LMoO(bdt) (1) experimental
frozen-solution (top) and composite simulated
spectrum (bottom).
23
Model Spectroscopy
EPR parameters indicate similar Mo environments
in TpMoO(S2DIFPEPP) and TpMoO(bdt)
simulation
experimental
24
Cu-substituted Alcohol Dehydrogenase Replacement
of the catalytic Zn(II) in horse liver alcohol
dehydrogenase (HLADH) with copper produces a
mononuclear Cu(II) chromophore with a ligand set
consisting of two cysteine sulphurs, one
histidine nitrogen plus one further atom. The
fourth ligand to the metal ion and the
conformation of the protein may be altered by
addition of exogenous ligands and/or the cofactor
NADH. The spectra obtained clearly fall into
two categories Figure (A), (B), (C) and (E),
where there is some rhombic distortion with g1 gt
g2 gt g3 and the copper hyperfine splitting of g1
is relatively small (which we take as evidence
for a high copper-thiolate covalence and
extensive ground-state coppersulphur orbital
mixing), and Figure (D), the binary complex with
pyrazole, which is the only truly axial species
with g1 gt g2 g3 and where the copper hyperfine
splitting of the g1 line is clearly much greater.
For the binary complex with pyrazole the g (g2,
g3) line is split into eight equally spaced
hyperfine lines, which is most easily explained
by equivalent interaction of the electron with
both the copper nucleus and the two nitrogen
ligands in the XY plane. Copper(II) is a 3d9
ion, i.e. it has four filled and one singly
occupied 3d orbitals. Before any analysis of the
optical spectrum can be undertaken it is
necessary to establish the nature of the
ground-state hole-orbital. The EPR spectrum shows
that the ground state approximates to one of
axial symmetry with g1 gt g2 . The g-values and
anisotropies of the Cu(II)-HLADH complexes are
not very different from those of typical blue
copper proteins
g3
g2
g1
25
Pulse EPR and 55Mn-ENDOR Experiments The
chemistry of photosynthetic water oxidation can
not be understood without knowing the electronic
structure of all intermediate states. The S2 and
S0 states are paramagnetic (S 1/2) and display
perpendicular mode EPR signals (Figure 7). A
direct analysis of the EPR signals involves too
many variables and therefore does not lead to
satisfying insights into the electronic structure
of the S2 and S0 states. Application of pulse
55Mn-ENDOR spectroscopy allows a precise
determination of the effective isotropic
hyperfine interaction parameters (Ai,iso). The
experimental spectra and simulations are shown in
Figure 8.
Figure 7 EPR multiline signals of the S0 (top
Messinger et al., Biochemistry 1997, 36,
11055-11060) and the S2 state (bottom Dismukes
and Siderer, PNAS 1981, 78, 274-278).
26
S 1/2 on a Mn(3),Mn(4) unit, a d4-d3
antiferromagnetically couple dimer. Each Mn has
I- 5/2 (each alone produces 6 lines), 2 Mn
produce 16 lines) see p. 309 text)
Proposed S 5/2 state of Mn cluster
27
Raman Spectroscopy
- A scattering technique
- Reveals vibrational levels
- Complementary selection rules to Infrared
Spectroscopy - IR Ddipole moment, ? Yg.s. me Ye.s. dt,
- where me has symmetry of x,y,z
- Raman Dpolarizability moment, ? Yg.s.P Ye.s.
dt, - where P has symmetry of Rx, Ry, Rz
- Good for aqueous biological samples no strong
O-H absorption
Laser source
Stokes Anti-Stokes
28
Resonance Raman (RR) Raman electronic
spectroscopy If the wavelength of the exciting
laser coincides with an electronic absorption of
a molecule, the intensity of Raman-active
vibrations associated with the absorbing
chromophore are enhanced by a factor of 100 to
10,000. This resonance enhancement or resonance
Raman effect can be extremely useful, not just in
significantly lowering the detection limits, but
also in introducing electronic selectivity.
RR of UO2 ion showing symmetric mode at 835
cm-1 is dependent on excitation energy
29
RR gives detailed orbital and energy information
about two MoO model systems 1.
30
2.
Figure 4. Gaussian resolved electron absorption
spectrum of 1 in acetonitrile, and solid state rR
excitation profiles. These vibrational modes
have been assigned as intraligand vibrations that
possess dominant quinoxoline character (1345
cm-1, red circles) and CC quinoxaline
character (1551 cm-1, blue circles). (Inset)
Electron density difference map that details the
nature of the intraligand transition in 1 (red
electron density loss in transition, green
electron density gain in transition H-atoms
omitted for clarity).
31
Magnetic Circular Dichroism (MCD)
Examples of questions that can be answered
What is the metal center oxidation state and spin
state? What are the effects of
inhibitors/substrate/mutations on the electronic
and magnetic properties of the metal
center(s)? What are the axial ligands on
low-spin ferric heme centers? Major
advantages All matter exhibits MCD
Improved resolution of electronic transitions
compared to absorption measurements
Selective determination of the electronic
properties of paramagnetic metal centers via
temperature-dependent studies Selective
investigation of magnetic properties of
individual metal centers via temperature and
magnetic field dependence studies of discrete
transitions
32
Magnetic Circular Dichroism (MCD)
MCD of 2p-3d excitation In the presence of the
applied magnetic field H, there are some empty
down spin 3d states. Only the 2p electrons with
down spin can be excited into the 3d states
because of the conservation of spins. When the
orbital motion of the 2p states is in the same
direction as the circular motion of the incident
light the transition probability is larger, while
when the two motions are in opposite directions
the probability is small. As a result the
spectrum shown in the figure (b) is obtained as
the difference in the absorption of right- and
left- circularly polarized light (LCP and RCP).
33
Comparison of MCD Spectrum and Absorption
Spectrum. Note additional features of MCD
compared to absorption spectrum
MCD
absorption
Note how two MCD have distinct differences Whereas
Absorption spectra are nearly identical.
34
Comparison of deconvoluted MCD and
Resolved Absorption spectra.
35
(No Transcript)
36
(No Transcript)
37
Pulse EPR and 55Mn-ENDOR Experiments The
chemistry of photosynthetic water oxidation can
not be understood without knowing the electronic
structure of all intermediate states. The S2 and
S0 states are paramagnetic (S 1/2) and display
perpendicular mode EPR signals (Figure 7). A
direct analysis of the EPR signals involves too
many variables and therefore does not lead to
satisfying insights into the electronic structure
of the S2 and S0 states. Application of pulse
55Mn-ENDOR spectroscopy allows a precise
determination of the effective isotropic
hyperfine interaction parameters (Ai,iso). The
experimental spectra and simulations are shown in
Figure 8.
Figure 7 EPR multiline signals of the S0 (top
Messinger et al., Biochemistry 1997, 36,
11055-11060) and the S2 state (bottom Dismukes
and Siderer, PNAS 1981, 78, 274-278).
38
S 1/2 on a Mn(3),Mn(4) unit, a d4-d3
antiferromagnetically couple dimer. Each Mn has
I- 5/2 (each alone produces 6 lines), 2 Mn
produce 16 lines) see p. 309 text)
Proposed S 5/2 state of Mn cluster
39
Figure 4. EPR spectra of the free radicals
produced upon oxidation of (A) the model compound
(i) and (C) acetosyringone by PoP
Biochem. J. (1996) 314 (421426) Mode of action
and active site of an extracellular peroxidase
from Pleurotus ostreatus Young-Hoon HAN,
Kwang-Soo SHIN, Hong-Duk YOUN, Yung Chil HAH
and Sa-Ouk KANG Seoul National University,
Seoul Korea and Department of Microbiology,
College of Sciences, Taejon University, Taejon
300-716, Republic of Korea The properties of the
haem environment of a peroxidase from Pleurotus
ostreatus were studied by electronic absorption
spectroscopy. A high-spin ferric form was
predominant in the native enzyme and a high-spin
ferrous form in the reduced enzyme. Cyanide was
readily bound to the haem iron in the native
form, thereby changing the enzyme to a low-spin
cyano adduct. Compound III of the enzyme was
formed after the addition of an excess of H2O2 to
the native enzyme, and thereafter spontaneously
reverted to the native form. The enzyme oxidized
a spin trap (shown in A) in the presence of H2O2
to produce its radical product. Free radicals
were detected as intermediates of the
enzyme-mediated oxidation of 1-(3,5-dimethoxy-4-hy
droxyphenyl)-2-(2-methoxyphenoxy)-1,3-dihydroxypro
pane and acetosyringone. These results can be
explained by the mechanisms involving an initial
one-electron oxidation of the lignin
substructure. This radical may undergo Ca-Cb
cleavage, Ca-oxidation and alkyl-phenyl
cleavage.
40
Model Spectroscopy
EPR parameters indicate similar Mo environments
in TpMoO(S2DIFPEPP) and TpMoO(bdt)
simulation
experimental
41
Model Spectroscopy
Magnetic Circular Dichroism (MCD) indicates
subtle differences between TpMoO(pterin-dithiolen
e) and TpMoO(benzene-dithiolene)
Low temperature (5K) MCD spectrum of
TpMoO(DIFPEPP) (red). Gaussian resolved bands
are presented as dashed lines and the resultant
spectral simulation is given in blue. Numbers
(cm-1) under peaks indicate change between
TpMoO(S2DIFPEPP) as compared to TpMoO(bdt)
-2000
-1700
same
-1000
same
-1400
42
Model Spectroscopy
MCD Band Assignmnets
43
Quinoxalyl Dithiolene model system
From the ML Kirk Lab Isodensity Density Plots
of HOMO LUMO
LUMO localized on quinoxaline
Note asymmetric electron density on dithiolene
Gordon Research Conference on Mo W Enzymes
Lucca, Italy 2009
HOMO localized on Mo d(xy)
44
Mössbauer Spectroscopy
From Introduction to Mössbauer Spectroscopy
http//www.rsc.org/Membership/Networking/InterestG
roups/MossbauerSpect/Intropart1.asp
Fig5 Elements of the periodic table which have
known Mössbauer isotopes (shown in red font).
Those which are used the most are shaded with
black
Process gamma radiation from source element
identical to that under study is reabsorbed by
sample nuclei. Measured as isomer shift, ?,
mm/sec and quadrupole splitting, ?Eq
45
Process gamma radiation from an excited source
element is reabsorbed by sample nuclei (of same
element) by resonance since the energies of
source and sample nuclei match.
However, energy lost to recoil of nuclei prevents
resonance and must be corrected. This is
accomplished by putting sample in solid matrix
which dampens any movement.
Recoiling nucleus emitted g ray
Matrix-embedded nucleus, emits g ray without
recoil
Entire process at rightemitter nucleus emits g
ray, absorbed by same type of nucleus in sample.
Detected as decrease in g ray intensity, shown as
descending peak in plot.
Now, want to observe the hyperfine interactions
of nucleus environment, a tiny energy
perturbation on the g ray absorption. Likened
to For the most common Mössbauer isotope, 57Fe,
this linewidth is 5x10⁻⁹ev. Compared to the
Mössbauer gamma-ray energy of 14.4keV this gives
a resolution of 1 in 1012, or the equivalent of a
small speck of dust on the back of an elephant or
one sheet of paper in the distance between the
Sun and the Earth. (!)
46
Such miniscule variations of the original
gamma-ray are quite easy to achieve by the use of
the doppler effect. In the same way that when an
ambulance's siren is raised in pitch when it's
moving towards you and lowered when moving away
from you, the gamma-ray source can be moved
towards and away from the absorber. This is most
often achieved by oscillating a radioactive
source with a velocity of a few mm/s and
recording the spectrum in discrete velocity
steps. Fractions of mm/s compared to the speed of
light (3x1011mm/s) gives the minute energy shifts
necessary to observe the hyperfine interactions.
For convenience the energy scale of a Mössbauer
spectrum is thus quoted in terms of the source
velocity, as shown in Fig1.
Mossbauer epctroscpy is threfore measured as
isomer shift, ?, mm/sec.
57Fe Mossbauer most useful in bioinorganic for
oxidation state and spin state identification. Not
e that this requires 57Fe site labeling.
Fe(2) high spin 1.3 mm/sec Fe(2) low spin
0.1 mm/sec Fe(3) high spin 0.5-0.7
mm/sec Fe(3) low spin 0 mm/sec
Resonance peak at 0 m/sec when source identical
to sample
47
Nuclei in states with an angular momentum quantum
number Igt1/2 have a non-spherical charge
distribution. This produces a nuclear quadrupole
moment. In the presence of an asymmetrical
electric field (produced by an asymmetric
electronic charge distribution or ligand
arrangement) this splits the nuclear energy
levels.
Quadrupole splitting, measured as DEq in mm/sec,
indicates 57Fe site symmetry
48
We utilized this apparent enhanced lability of
one iron of the 4Fe-4S cluster to achieve
site-specific labeling of the unique site with
57Fe (above). After the 4Fe-4S-PFL-AE had been
exposed to oxidant, the released iron was removed
by gel filtration chromatography and the
3Fe-4S formed was quantified by EPR
spectroscopy. An equimolar equivalent of 57Fe(II)
and a small excess of dithiothreitol (DTT) was
then added, and the resulting protein, which was
EPR-silent, was examined by Mössbauer
spectroscopy in the absence and presence of
S-adenosylmethionine SAM (Figure 8). The results
show that the added 57Fe(II) is incorporated into
the cluster, as spectrum A is a typical
quadrupole doublet for iron in a 4Fe-4S2
cluster ( 0.42 mm/s, EQ 1.12 mm/s). The
Mössbauer spectrum is dramatically perturbed,
however, upon addition of SAM, as shown by
spectrum B and the difference spectrum C in
Figure 8. A new quadrupole doublet appears with
parameters ( 0.72 mm/s, EQ 1.15 mm/s) that
are inconsistent with the typical iron
environment in a 4Fe-4S2 cluster and suggest
an increase in coordination number and/or binding
of more ionic ligands to the unique site iron.80
Significantly, when a 357Fe-4S cluster is
generated in 57Fe -enriched PFL-AE and
natural-abundance Fe(II) and DTT are added, no
perturbation of the Mössbauer spectrum is
observed upon addition of SAM, consistent with
the selective binding of the added iron to the
unique site. These results clearly demonstrated
for the first time the presence of a unique iron
site in the 4Fe-4S cluster of PFL-AE and
provided evidence for interaction of SAM with the
unique iron site.
Figure 8 Mössbauer spectra of PFL-AE
site-specifically labeled at the unique iron site
with 57Fe. (A) 356Fe157Fe4S2 in the absence of
SAM. (B) 356Fe157Fe4S2 in the presence of SAM.
(C) Difference spectrum B - A. (D) Difference
spectrum of spectra recorded at high field.
Recommended
