
EFFECTS OF PERSISTENT DEMOGRAPHIC HETEROGENEITY ON PowerPoint PPT Presentation
1 / 1
Title: EFFECTS OF PERSISTENT DEMOGRAPHIC HETEROGENEITY ON
1
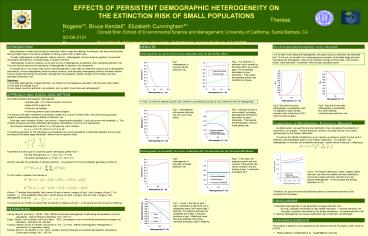
EFFECTS OF PERSISTENT DEMOGRAPHIC HETEROGENEITY
ON THE EXTINCTION RISK OF SMALL POPULATIONS
Theresa Nogeire, Bruce Kendall,
Elizabeth Cunningham Donald Bren School of
Environmental Science and Management, University
of California, Santa Barbara, CA 93106-5131
Department of Economics, University of
California, Santa Barbara, CA 93106
Bias from ignoring heterogeneity can be
substantial
INTRODUCTION
RESULTS
Most population models assume that all
individuals within a class are identical for
example, that they have the same birth and death
rates (or the same probability of having a given
birth or death rate). In reality,
heterogeneity in demographic rates is common.
Heterogeneity can be caused by genetics,
environment during early development, microsite
quality, or quality of territory.
Heterogeneity is hard to measure, so we want to
know if heterogeneity is important when
calculating extinction risk. This work aims to
examine the importance of heterogeneity to
extinction risk calculations. B. Kendall and
G. Fox (2002) have shown that heterogeneity in
vital rates can affect the variance due to
demographic stochasticity survival heterogeneity
tends to reduce variance, while fecundity
heterogeneity tends to increase variance. Thus
we expect that failing to incorporate
heterogeneity into population viability analysis
(PVA) models may bias estimates of extinction
risk.
Heterogeneity in survival decreases extinction
risk via the frailty effect.
? If we didnt know about the heterogeneity, how
good would our extinction risk estimates be? To
find out, we sample from a heterogeneous
population at its stable stage structure,
calculating the demographic rates as the weighted
average of those rates. We compare these naïve
estimates of extinction risks to those
calculated above.
Fig 1. Heterogeneity in survival reduces
extinction risk.
Fig 2. The reduction in extinction risk is
caused by the frailty effect as a cohort ages,
it is increasingly dominated by type 1
individuals. This causes the expected growth
rate (lambda) to increase.
Questions 1) How does heterogeneity change
extinction risk relative to a homogeneous
population with the same mean traits? 2) Why does
this change occur? 3) How biased would our
extinction risk prediction be if we didnt know
there was heterogeneity?
APPROACH AND MODEL DESCRIPTION
- We model persistent demographic heterogeneity
- Individual gets 1 of 2 traits at random when born
- Keeps trait throughout life
- Traits are not heritable
- A surviving parent is also considered progeny
- This scenario has been considered in simulation
models (e.g. Conner White 1999). We use
branching process models to systematically
analyze effects on extinction risk. - Each year, each individual of type i can
produce 1 offspring with probability fi, and can
survive with probability si. This process
introduces binomially distributed demographic
stochasticity in survival and reproduction. - We introduce heterogeneity in either f or s,
but keep the mean constant - (s1,s2) ? (0.5,0.5), (0.6,0.4), (0.7,0.3), etc.
- The starting population of 100 individuals (we
considered only small populations) is distributed
between the two types according to the stable
stage distribution, derived from the growth
matrix - Parameters are set to give an expected growth
rate slightly greater than 1 - Survival heterogeneity (s1 s2)/2 0.5, f
0.501 - Fecundity heterogeneity s 0.501, (f1 f2)/2
0.5
? Next, we hold the expected growth rate constant
by decreasing fecundity as we increase the level
of heterogeneity.
Fig 8. Bias due to survival heterogeneity is
substantial when f is adjusted to keep lambda
constant bias is less than 0.0001 when f is held
constant.
Fig 9. Bias due to fecundity heterogeneity is
substantial. Our naïve estimate underestimates
extinction risk.
Fig 3. Heterogeneity still reduces extinction
risk, but much more slowly.
Fig 4. Although lambda is now constant,
increasing heterogeneity still leads to
domination by type 1 individuals. This reduces
the demographic variance in the growth rate.
Comparison of Distributions Poisson vs. Binomial
As stated earlier, we used the binomial
distribution when calculating the probability of
outcomes in our analysis. In some scenarios,
however, fecundity may be more closely
approximated by the Poisson distribution.
To examine the effects of distribution on our
results, we allowed a parent to have up to 5
offspring, with probabilities based on the
Poisson distribution. For example, with
heterogeneity in fecundity, the probability that
a type 1 parent leaves three type 2 offspring is
Heterogeneity in fecundity increases extinction
risk via selection for less fecund individuals.
Fig 5. Heterogeneity in fecundity increases
extinction risk.
Fig 6. In this case, the expected growth rate
and variance in the growth rate remain constant,
and the fraction of type 1 individuals is
constant at ½.
We then calculate the probability of ultimate
extinction. The general form for the probability
generating function is For the model in
question this reduces to
Fig 10. The Poisson distribution yields a
slightly higher extinction risk then the modeled
binomial distribution, which has a higher
extinction risk then if we had ignored
heterogeneity. (In this analysis the starting
population is 10.)
Therefore, our use of the binomial distribution
gives a conservative estimate of bias compared to
the Poisson.
Where denotes the probability that a
parent of type m leaves i progeny of type 1 and j
progeny of type 2. For example, is the
probability that a type 1 parent leaves one type
1 progeny and zero type 2 progeny, with
heterogeneity in survival This result occurs if
either the parent dies and leaves an offspring of
type 1, or the parent survives but has no
offspring.
CONCLUSIONS
Fig 7. In year 1 the ratio of type 1 type 2
individuals is still 5050, but in subsequent
years, the fraction type 1 declines. This happens
because the probability that a type 2 individual
produces a type 1 offspring is lower than the
probability that a type 1 individual produces a
type 2 offspring.
- Persistent heterogeneity in vital parameters
changes extinction risk. - Survival population dominated by
high fitness individuals ? reduces extinction
risk - Fecundity population dominated by low
fitness individuals ? increases extinction risk - 2) Ignoring heterogeneity can cause a systematic
bias in extinction risk estimates.
REFERENCES
Conner, Mary M. and Gary C. White. 1999.
Effects of individual heterogeneity in estimating
the persistence of small
populations. Natural Resource Modeling 12(1)
109-127. Engen, Steiner, Oyvind Bakke, and
Aminul Islam. 1998. Demographic and
environmental stochasticity-concepts and
definitions. Biometrics 54
840-846. Fujiwara, Masami, Bruce E. Kendall, and
Gordon A. Fox. In review. Effects of
demographic heterogeneity in
reproduction on population viability. Kendall,
Bruce E. and Gordon A. Fox. 2002. Variation
among individuals and reduced demographic
stochasticity. Conservation
Biology 16(1) 109-116.
ACKNOWLEDGMENTS
This material is based on work supported by the
National Science Foundation under Grant No.
615024.
Please address correspondence to
tnogeire_at_bren.ucsb.edu
Recommended
