
Microarrays PowerPoint PPT Presentation
1 / 88
Title: Microarrays
1
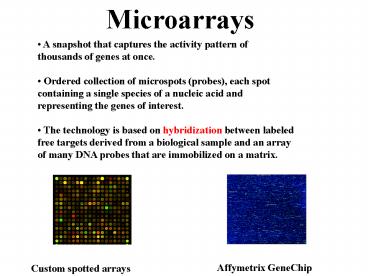
Microarrays
- A snapshot that captures the activity pattern of
- thousands of genes at once.
- Ordered collection of microspots (probes), each
spot - containing a single species of a nucleic acid and
- representing the genes of interest.
- The technology is based on hybridization between
labeled - free targets derived from a biological sample and
an array - of many DNA probes that are immobilized on a
matrix.
Affymetrix GeneChip
Custom spotted arrays
2
Gene Expression Transcription
The majority of genes are expressed as the
proteins they encode. This process occurs in two
steps
DNA
RNA
Transcription Translation
RNA
Protein
By measuring amounts of mRNA for any specific
gene, we can identify changes in gene
regulation. Genes which behave very differently
in a disease state versus a normal state can be
inferred to have something to do with a disease.
3
Transcriptome
Represents the universe of RNA messengers that
may code for proteins. Only approximately 5 of
genes are active in a particular cell at any
given point in time. Most of the genes are
repressed, and this control may occur at either
the transcriptional or the translational level.
Since the regulation of protein expression at the
level of transcription is more efficient, most
control takes place at this level. Gene
expression profile of a cell determines its
function, phenotype, and response to external
stimuli. Therefore gene expression profiles
help to elucidate Cellular functions Biochem
ical pathways Regulatory mechanisms In
addition, profiles of disease tissues/cells,
compared with normal controls, may promote the
understanding of disease pathology and identify
new therapeutic points of intervention,
improving diagnostics, and clarifying prognosis.
4
How it works.
Construct or buy the microarray
Collect mRNA
Transcribe mRNA into cDNA and add fluorescent
labels.
Apply labeled cDNA(spotted) or cRNA(Affy) to
chip. Binding of the probe to the chip indicates
that the gene is expressed.
5
Sample Collection
Integrity of sample is CRITICAL!!!
Immediately snap freeze in liquid nitrogen
6
Tissue characteristics that make RNA isolation
challenging.
7
Total RNA isolation methods
RNeasy Stabilization and Total RNA Isolation
System
8
Agilent 2100 Bioanalyzer RNA Quality
9
RNA quality
Ribosomal products are very abundant and provide
an easy assessment of the RNA integrity of a
sample.
Good rRNA ratio gt1.7
Fair rRNA ratio 1.2-1.6
Bad rRNA ratio lt1.2
10
vs.
Good quality RNA
Poor quality RNA
11
Yields of Total RNA isolated from Tissue
12
Challenges in samples size
Core biopsies Fine needle aspirate Laser capture
microdissection
RNA amplification
Maintain integrity of sample Maintain
quantitative relationships Maintain
reproducibility
13
Formalin Fixed Paraffin samples
14
Type of yields from FFPE (and LCM)
15
(No Transcript)
16
(No Transcript)
17
Experimental Design
18
Types of Microarray Experiments
19
Microarray Operational flow.
20
- Some issues to consider before designing
microarray experiments - Scientific
- Aims of the experiment
- Specific questions and priorities between them.
- How will the experiments answer the questions
posed? - Practical (Logistic)
- Types of mRNA samples reference, control,
treatment, mutant, etc - Amount of material needed for entire experiment
- The number of slides/arrays available for the
experiment. - Other Information
- The experimental process prior to hybridization
sample isolation, RNA extraction, amplification,
labelling, - Controls planned positive, negative, ratio, etc.
- Verification method Validation sets, Northern,
RT-PCR, in situ hybridization, etc.
21
Challenges in obtaining reliable Microarray Data
How many ???
More replication is needed for Finding small
differences in genes expressed at modest
levels Experiments using tissue
samples Experiments with NO confirmatory testing
(i.e. RT-PCR)
Less replication is needed for Finding gross
patterns among highly expressed genes Experiments
using cell line samples Experiments incorporating
confirmatory testing such as Northern blots or
Real-time PCR
22
Steps in a Microarray experiment that contribute
to data variability
- Biological sample
- Treatment
- Sampling
Biological Replication
- Labeled sample
- RNA extraction
- (total RNA, mRNA)
- Amplification
- Labeled nucleic acid
- synthesis (cDNA, cRNA)
Technical Replication
- Array Hybridization
- Hybridization
- Washing and staining
- Scanning
Technical Repetition
23
Variation in Microarray Data is caused by
Biological Variation Strains Animals Tissues Time
points
Processing variation caused by Quality of
experimental sample Labeling effects Hybridization
effects Background effects
24
Types of Experimental Design
Tumor vs. control Tumor gene expression profile
is compared with its corresponding control
sample to measure the differences and
similarities between both phenotypes.
Cancer stratification Gene expression profiles
from different samples of the same cancer
type are compared to reveal distinct subgroups to
better define molecular classification of a
common histological type of cancer.
Temporal evaluation of the tumor Gene expression
patterns from tumor samples derived from
different stages of progression are compared to
elucidate the differences between the early and
advanced stages of the disease.
25
Data analysis approach.
26
BUDGET
Affymetrix array assay 900.00 /sample (450.00/ar
ray, 450.00/reagents and labor) Spotted
Microarray assay 150.00/sample (75.00/array,
75.00/reagents and labor)
27
Array Fabrication
Affymetrix GeneChip arrays
Custom spotted arrays
28
Custom Spotted Array Fabrication
cDNA Oligonucleotides (50-80mers)
29
Poly-l-lysine slides or commercially available
slides (CGAP)
Primary amine groups (NH3) attached covalently
to the glass surface (rectangles). The amines
carry a positive charge at neutral pH, allowing
attachment of native DNA (red ribbons) through
the formation of ionic bonds with the negatively
charged phosphate backbone (middle panel).
Electrostatic attachment is supplemented by
treatment with ultraviolet light or heat, which
induces covalent attachment of the DNA to the
surface (right panel). The combination of
electrostatic binding and covalent attachment
couples the DNA to the substrate is a highly
stable manner.
30
Printing with TeleChem printhead and 16 pins
(SMP 3,90-100 microns)
GeneMachines OmniGrid Arrayer With Robiotic Arm
31
(No Transcript)
32
(No Transcript)
33
TeleChem Micro Spotting pins and printhead
48 pin printhead
SMP3 pin Prints 90-100 mm spots
34
Determining Oligonucleotide sequences for making
spotted arrays
35
(No Transcript)
36
Length Specificity
- Analysis of 90 randomly chosen yeast genes
- 20-30mer oligonucleotides had too many non-target
- sequences with gt75 similarity
- 50-80mer oligonucleotides have very few
non-target sequences - with gt75 similarity
- The longer the oligo, the higher the chance for a
stretch of - complementary sequence of 15 and more contiguous
bases. - Increase possibility of secondary structure
formation - Reduce flexibility in oligo probe design.
37
Operon Oligonucleotide Genome Sets Human
21,656 Mouse 16,463 Rat 6,273 Yeast 6,307 C.
albicans 6,266 cDNA Arrays Ferret Songbird Mouse
full length Cryptococcus L. Pine
38
POPO-3 stain
- Detect depletion of sample due to vaporation.
- Detect spots of low concentration of DNA.
POPO-3 is a intercalating cyanine dimer, which
excites and detects the ssDNA at the Cy3 channel
of a microarray scanner (532 wavelength).
39
GeneChip Probe Array
40
Probe Tiling StrategyGene Expression
(25-mer)
41
Synthesis of Ordered Oligonucleotide Arrays
42
GeneChip Probe Arrays
Hybridized Probe Cell
GeneChip Probe Array
Single stranded, fluorescently labeled DNA target
24µm
Oligonucleotide probe
1.28cm
Each probe cell or feature contains millions of
copies of a specific oligonucleotide probe
Over 250,000 different probes complementary to
genetic information of interest
Image of Hybridized Probe Array
43
Probe labeling
44
Specificity
45
Biotin - labeled cRNA transcript
Cells
Poly (A) RNA Or Total RNA
IVT Biotin-UTP Biotin-CTP
Affymetrix Arrays (one sample)
cDNA
Fragment heat, Mg2
(10mg)
Hybridize
(16 hours)
Wash Stain
Biotin - labeled cRNA fragments
Scan
(75 minutes)
Add Oligo B2 Staggered Spike Controls
(8 minutes)
Spotted Arrays (two samples)
46
Hybridization signal produced on each probe is
the mRNA expression level of the corresponding
gene in the sample at the time of the study.
The signals are detected, quantified, integrated
and normalized with dedicated software and
reflect the gene expression profile or
molecular portrait for each biological sample.
47
Affymetrix Labeling One sample
48
Affymetrix controls
Control Oligo B2 hybridizes to features along the
outer edge of all expression arrays and to the
checkerboard pattern in each corner. These
predefined patterns provide signals for the
Affymetrix Microarray Suite software to perform
automatic grid alignment during image analysis.
They can also be used to align the grid manually.
The fluorescence intensities for Control Oligo B2
are not used for analyzing data.
BioB, bioC, and bioD are genes of the biotin
synthesis pathway from the bacteria E. coli, and
cre is the recombinase gene from P1
bacteriophage. A ready-prepared mixture of these
biotinylated controls at staggered concentrations
can be added with labeled eukaryotic cRNA samples
to hybridize onto GeneChip probe arrays. Signal
intensities obtained on these genes provide
information on how well the hybridization,
washing, and staining procedures have performed.
49
(No Transcript)
50
DNA hybridization
Single stranded nucleic acids hydrogen bond to
each other efficiently at 20-25 degrees
centigrade below their melting point.
When hybridizing a probe (sample of interest) to
the DNA on the microarray, we adjust the
hybridization solution conditions (i.e. salt
concentrations) so that the melting point of the
nucleic acids is approximately 20-25 degrees
higher than the incubation temperature.
42 C or 65 C overnight
Following a period of hybridization, it is
necessary to wash off the probe that is Loosely
bound to the membrane, this is to remove any
nonspecifically bound probe.
This is done by a washing step that is done at
several times at 42 C (in the presence of
formamide) in decreasing salt concentrations.
51
What is happening during hybridization of a probe?
- A single stranded probe is finding DNA sequences
that it can hydrogen bond to, and these - hydrogen bonds cause the two molecules to stick
together. - In general on microarrays we are using single
stranded oligonucleotides, the probe is - boiled at 95 C (denatured) before it is added to
the hybridization mixture. The probe is - labeled on both strands so either strand can
hybridize with a DNA strand on the microarray.
- Concentration of the probe in the hybridization
reaction is IMPORTANT, because there - has to be some reasonable chance of the probe
molecule bumping into the target molecule. - The total amount of the probe should be in
excess over the amount of target DNA.
- The labeled probe, once bound to the target
sequence, will broadcast its presence by the - fact that it is chemically labeled. The amount
of label incorporated is called the specific
activity of your probe.
52
What is responsible for the stringency of the
hybridization?
- Temperature
- Salt concentrations
- Denaturing additives, such as formamide
Lowering the salt concentration lowers the
melting point, as does the addition of formamide.
53
What is responsible for the efficiency of
hybridizations?
- Probe characteristics
- GC richness
- Length
- Similarity to target
54
Spotted Array Direct Labeling Two Samples
55
ratio gt 1.0
ratio 1.0
ratio lt 1.0
56
Arabadopsis oligo controls (printed in the MO17K
array)
A.
57
Data Collection and Analysis
Axon GenePix 4000B
Affymetrix GeneChip System
58
(No Transcript)
59
Affymetrix Results
www.expressionanalysis.com
60
Affymetrix Array Data
.DAT file, image file of chip in Affymetrix
software format 43,754 KB
.CEL file, contains individual probe cell
measurements 32,148 KB .RPT file, contains
control information 3 KB .CHP file, contains
results in Affymetrix software format 11,953 KB
.EXP file, contains info about wash/stain/scan
2 KB
_v5a.txt, contains control info with scaling
factor for chip 1 KB _v5p.txt, contains raw
data for chip 14,005 KB
Average total size of data for one array (one
sample) 101,866 KB
61
Naming convention for Affymetrix Data files
Sample 12-1A from David Seo that was hybridized
to Affy Hu95Av2 GeneChip array
0035_2992_H95A2_12-1A_v5a.txt 0035_2992_H95A2_12-1
A_v5p.txt 0035_2992_H95A2_12-1A.CEL 0035_2992_H95A
2_12-1A.DAT 0035_2992_H95A2_12-1A.CHP 0035_2992_H9
5A2_12-1A.RPT 0035_2992_H95A2_12-1A.EXP
Unique Genome ID number
Project ID number
Sample name
Type of Affymetrix chip
62
.DAT file and .CEL file
63
Absolute Analysis
64
_v5a.txt
65
_v5p.txt
66
Express files
67
Treated vs. reference RNA
Upregulated or overexpressed, ratio gt 1.0
Equal expression, ratio 1.0
Downregulated or underexpressed, ratio lt 1.0
68
GenePix Pro Features
- Feature Viewer
P pixel intensity F feature intensity B
background intensity Rp ratio of pixel
intensities Rm ratio of means mR median of
ratios rR regression ratio
69
GenePix Pro Features
- Results Ratio of median Cy5/Cy3
70
.GPR file format
71
Spotted Array Data
_532.TIFF file, image file of Cy3 wavelength
12,215 KB _635.TIFF file, image file of the Cy5
wavelength 13,100 KB _R1.JPG file, compiled
image file of the array 8,780 KB
.GPS file, grid alignment file for the image
1,467 KB
.GPR file, raw data text file 5,260 KB
Average total size of data for one array (two
samples) 40,822 KB
72
Naming convention for Spotted Array Data files
Sample 41369 ovarian tumor from Johnathan
Lancaster that was hybridized with a Human
Reference RNA to Human Operon Oligo printed arrays
0132_1388_A2_046_HO21K_41369_Href.GPR 0132_1388_A2
_046_HO21K_41369_Href.GPS 0132_1388_A2_046_HO21K_
41369_Href_532.TIFF 0132_1388_A2_046_HO21K_41369_
Href_635.TIFF 0132_1388_A2_046_HO21K_41369_Href_R
1.JPG
Spotted array type
Project ID number
Cy3 labeled Sample name
Unique Genome ID number
Slide number in print run
Cy5 labeled Sample name
Print run
73
Integrate multiple types of genomic and clinical
data into a scalable/flexible database that can
be queried by Basic Science and Clinical
Translational Researchers
Pathways
74
Challenges in the Explosion of Microarray Data
- Data collection and management
- Comparison across arrays
- Association of Clinical Variables
- Gene Annotation
75
Infrastructure of data collection and management
MIAME (Minimum Information About a Microarray
Experiment)
Array Fabrication
Product Annotation
76
Infrastructure of data collection and management
MIAME (Minimum Information About a Microarray
Experiment)
Protocols (P)
Sample Annotation
77
Infrastructure of data collection and management
MIAME (Minimum Information About a Microarray
Experiment)
Hybridization condition Image Aquisition
78
Infrastructure of data collection and management
MIAME (Minimum Information About a Microarray
Experiment)
Analysis of data
79
Infrastructure of data collection and management
Clinical parameters (age, sex, treatment,
biomarkers, patient follow up data, etc)
Other genomic or proteomic information (RT-PCR,
SNPs, protein expression data, etc..)
80
Spotted Array Data
BASE
http//base.thep.lu.se/
81
Gene Annotation
82
GeneChip Probe Array Probe Set Name Designations
In addition to the _at (antisense target) and
_st (sense target) probe set name designations,
there are other designations that reflect special
characteristics of a particular probe set based
on probe design and selection criteria. _f_at
(sequence family) Probe set that corresponds to
sequences for which it was not possible to pick a
full set of 16-20 unique and/or shared
similarity-constrained probes. Some probes in
this set are similar (e.g., polymorphic) but not
necessarily identical to other gene sequences.
Some family members overlap a portion of the
probe set. _s_at (similarity constraint) Probe
set that corresponds to a small number of unique
genes (lt5) that share identical sequence. Probes
were chosen from the region that is common to
these genes. Group members can be singleton or a
group of sequences. For _s probe sets, there is
not enough unique sequence to design a separate
_at probe set. _g_at (common groups) Probes
chosen in region of overlap. To differentiate
from an _s group, the sequences are represented
as singletons (_at probe sets either have the
same probe set ID number or the preceding probe
set ID number) on the same probe array as well.
In other words, for _g probe sets, there is
enough unique sequence to design a separate _at
probe set. _r_at (rules dropped) Designates
sequences for which it was not possible to pick a
full set of unique probes using Affymetrix probe
selection rules. Probes were picked after
dropping some of the selection rules. _i_at
(incomplete) Designates sequences for which
there are fewer than the required numbers of
unique probes specified in the design. _b_at
(ambiguous probe set) All probe selection rules
were ignored. Withdrawn from GenBank. _l_at
(long probe set) Sequence represented by more
than 20 probe pairs.
83
GeneChip Probe Array Probe Set Name Designations
Probe Set Name Designations for HG-U133 Set
(These are the only probe set extensions used in
the HG-U133 Set) _s_at Designates probe sets
that share all probes identically with two or
more sequences. The _s probe sets can
represent shorter forms of alternatively
polyadenylated transcripts, common regions in the
3 ends of multiple alternative splice forms, or
highly similar transcripts. Approximately 90 of
the _s probe sets represent splice variants. Some
transcripts will also be represented by unique
_at probe sets. _x_at Designates probe sets
that share some probes identically with two or
more sequences. Rules for cross-hybridization were
dropped in order to design the _x probe
sets. Probe Set Name Designations for Rat 230
Set (These are the only probe set extensions used
in the Rat 230 Set) _a_at Designates probe sets
that recognize multiple alternative transcripts
from the same gene (on HG-U133 these probe
sets have an _s suffix). _s_at Designates
probe sets that share common probes among
multiple transcripts from different
genes. _x_at Designates probe sets where it was
not possible to select either a unique probe set
or a probe set with identical probes among
multiple transcripts. Rules for
cross-hybridization were dropped. Therefore,
these probe sets may crosshybridize in an
unpredictable manner with other sequences. Probe
Set Name Designations for Mouse 430 Set (These
are the only probe set extensions used in the
Mouse 430 Set) _a_at Designates probe sets that
recognize multiple alternative transcripts from
the same gene (on HG-U133 these probe sets have
an _s suffix). _s_at Designates probe sets
that share common probes among multiple
transcripts from different genes. _x_at Designate
s probe sets where it was not possible to select
either a unique probe set or a probe set with
identical probes among multiple transcripts.
Rules for cross-hybridization were dropped.
Therefore, these probe sets may
cross-hybridize in an unpredictable manner with
other sequences.
84
Gene annotation transformation
_v5p.txt
Table downloaded from Affy web site
85
DIG Gene Annotation http//dig.cgt.duke.edu
86
Caveats along the way to consider.
87
Limitations
- COST
- Lack of rigorous standards for data collection,
- analysis and validation.
- Quality and amount of RNA is a major challenge
- False data maybe generated from degraded RNA
- Heterogeneity of cells in tumors
- Experiments need to be replicated in order to
eliminate numerous error prone steps in
microarray experiments.
- Small sample size of many clinical specimens
from - early diagnosis
- Need more tools to aide in understanding the
biological - context of the gene lists that are derived from
the analysis
88
Future Benefit
Predicting those who will develop cancer, how
this disease will behave, and how the disease
will respond to therapy after diagnosis will be
one of the potential benefits of this technology
within the next decade.
Recommended
