
Vertical and horizontal shifts - PowerPoint PPT Presentation
1 / 31
Title:
Vertical and horizontal shifts
Description:
Note that this reflection can be obtained by applying the two previous reflections in sequence. ... The above computation illustrates a general fact: ... – PowerPoint PPT presentation
Number of Views:627
Avg rating:3.0/5.0
Title: Vertical and horizontal shifts
1
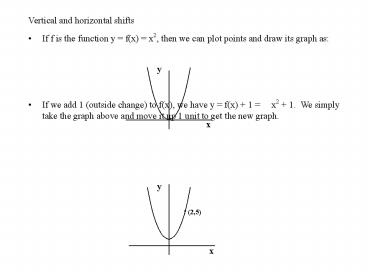
Vertical and horizontal shifts
- If f is the function y f(x) x2, then we can
plot points and draw its graph as - If we add 1 (outside change) to f(x), we have y
f(x) 1 x2 1. We simply take the graph
above and move it up 1 unit to get the new graph.
y
x
y
(2,5)
x
2
- If we replace x by x2 (inside change) to form
the function y f(x2) (x2)2, then the
corresponding graph is obtained from the graph of
y x2 by moving it 2 units to the left along the
x-axis. - If we replace x by x1 (inside change) to form
the function y f(x1) (x1)2, then the
corresponding graph is obtained from the graph of
y x2 by moving it 1 unit to the right along the
x-axis.
y
x
(-2,0)
y
x
(1,0)
3
If y g(x) is a function and k is a constant,
then the graph of
- y g(x) k is the graph of y g(x) shifted
vertically by k units. If k gt 0, the shift is
up, and if k lt 0, the shift is down. - y g(xk) is the graph of y g(x) shifted
horizontally by k units. If k gt 0, the shift
is left, and if k lt 0, the shift is right.
Horizontal and vertical shifts of the graph of a
function are called translations.
4
An example which combines horizontal and vertical
shifts
- Problem. Use the graph of y f(x) x2 to
sketch the graph of g(x) f(x2) 1 (x2)2
1. Solution. The graph of g is the
graph of f shifted to the right by 2 units and
down 1 unit as shown below.
y
x
(2,-1)
5
Reflections and symmetry
- Suppose that we are given the function y f(x)
as shown. - If we define y g(x) f(x), then the graph of
g may be obtained by reflecting the graph of f
vertically across the x-axis as shown next.
y
x
y
x
6
Continuation of example from previous slide
- If we define y h(x) f(x), then the graph of
h is obtained by reflecting the graph of f
horizontally across the y-axis as shown next. - Next, we define y p(x) f(x). The graph of
p is obtained by reflecting the graph of f about
the origin as shown next.
y
x
y
x
7
For any function f
- The graph of y f(x) is the reflection of the
graph of y f(x) across the x-axis. - The graph of y f(x) is the reflection of the
graph of y f(x) across the y-axis. - The graph of y f(x) is the reflection of the
graph of y f(x) about the origin. Note
that this reflection can be obtained by applying
the two previous reflections in sequence.
8
Symmetries of graphs
- A function is called an even function if, for all
values of x in the domain of f,
The graph of an even function is symmetric across
the y-axis. Examples of even functions are power
functions with even exponents, such as y x2, y
x4, y x6, ... - A function is called an odd function if, for all
values of x in the domain of f,
The graph of an odd function is symmetric about
the origin. Examples of odd functions are power
functions with odd exponents, such as y x1, y
x3, y x5, ...
9
- Problem. Is the function f(x) x3x even, odd,
or neither? Solution. Since
2 f(1) is not equal to f(1) 2, it follows
that f is not even. Since
f(x)
f(x), it follows that f is odd.
y x3x
Note the symmetry about the origin.
10
- Problem. Is the function f(x) x even, odd,
or neither? Solution. Since
f(x) x f(x), it follows that f is
even. Since 1 f(1) is not equal to
f(1) 1, it follows that f is not odd. - Question. Is it possible for a function to be
both even and odd?
y x
Note the symmetry about the y-axis.
11
Combining shifts and reflections--an example
- In an earlier example, we discussed an investment
of 10000 in the latest dotcom venture. This
investment had a value of 10000(0.95)t dollars
after t years. Suppose that we want to graph the
amount of the loss after t years for this
investment. The formula for the loss
is 10000
10000(0.95)t - The loss is graphed on the next slide using
Maple.
Shift Upwards
Reflect across t-axis
12
Use of Maple to graph loss on dotcom investment
gt plot(10000,10000-10000(0.95)t,t0..80,
colorblack,labels"t","L")
The graph of the loss has a horizontal asymptote,
L 10000.
13
Vertical Stretches and Compressions
- If f(x) x2 and g(x) 5x2, then the graph of g
is obtained from the graph of f by stretching it
vertically by a factor of 5 as the following
Maple plot shows
14
- If f(x) x2 and g(x) -5x2, then the graph of g
is obtained from the graph of f by stretching it
vertically by a factor of 5 and then reflecting
it across the x-axis as the following Maple plot
shows
15
- If we compare the graphs of f(x) x2 and g(x)
(1/2)x2, we notice that the graph of g can be
found by vertically compressing the graph of f by
a factor of 1/2. - Generalizing the above examples yields the
following If f is a function and k is a
constant, then the graph of y kf(x) is
the graph of y f(x) Vertically
stretched by a factor of k, if k gt 1.
Vertically compressed by a factor of k, if 0 lt k
lt 1. Vertically stretched or
compressed by a factor k and reflected
across the x-axis, if k lt 0.
16
Vertical Stretch Factors and Average Rates of
Change
- If f(x) x2 and g(x) 5x2, we compute the
average rates of change of the two functions on
the interval 1,3 as follows - The above computation illustrates a general
fact
17
- If f(x) 4x2 and g(x) 4 (2x)2, then the
graph of g is obtained from the graph of f by
compressing it horizontally by a factor of 1/2 as
the following Maple plot shows
18
- If f(x) 4x2 and g(x) 4 (0.5x)2, then the
graph of g is obtained from the graph of f by
stretching it horizontally by a factor of 2 as
the following Maple plot shows
19
- Generalizing the two previous examples yields the
following results for horizontal stretch or
compression. - If f is a function and k is a positive constant,
then the graph of y f(kx) is the graph of
f Horizontally compressed by a
factor of 1/k if k gt 1. Horizontally
stretched by a factor of 1/k if k lt 1.
If k lt 0, then the graph of y f(kx) also
involves a horizontal reflection about the y-axis.
20
The Family of Quadratic Functions
- A quadratic function is a function with a formula
in one of the following forms
Standard form y ax2bxc, where a, b, c, are
constants, Vertex form
y a(xh)2k, where a, h, k are
constants, - The graph of a quadratic function is called a
parabola. - Conversion from one form to the other for a
quadratic function is discussed on the next
slide.
21
- To convert a quadratic function from vertex form
to standard form, simply multiply out the squared
term. To convert from standard form to vertex
form, we complete the square as illustrated in
the following example. - Example. Put the following quadratic function
into vertex form by completing the
square. (1) Factor out the
coefficient of x2, which is 4.
(2) Add and subtract the square of half the
coefficient of the
x-term.
(3) Write the equation in vertex form.
perfect square
22
The Vertex of a Parabola
- Recall that the graph of a quadratic is called a
parabola. - The parabola corresponding to y
a(xh)2k Has vertex
(h, k). Has axis of
symmetry x h.
Opens upward if a gt 0 or downward if a lt 0.
23
Finding the vertex of a parabola
- Example. For the previous example, graph the
parabola and find the vertex.
We note that the vertex is at (3/2, 1). The
graph follows
24
Finding a formula for a parabola
- If we know the vertex of a quadratic function and
one other point, we can use the vertex form to
find its formula, as shown in the following
example. - Example. A parabola has vertex at (3, 2) and
(0, 5) is on the parabola. Find the formula for
the corresponding quadratic, f(x). Use the
vertex form with h 3 and k 2. This results
in To
find the value of a, we substitute x 0 and y
5 into this formula, obtaining a 1/3. The
formula is therefore
25
Finding a formula for a parabola, continued.
- If three points on a parabola are given, we can
use the standard form of the corresponding
quadratic to find the formula. - Example. Suppose the points (0, 6), (1, 0), and
(3, 0) are on a parabola. Find a formula for the
parabola. Use the standard form y ax2bxc.
Since (0, 6) is on the parabola, it follows that
c 6. From the other two points, we
have This system
can be solved simultaneously for a and b. We
obtain a 2 and b 8. Thus, the equation of
the parabola is y 2x28x6.
26
Finding the zeros of a quadratic function.
- The zeros of a function f are values of x for
which f(x) 0. - In addition to the standard and vertex forms,
some quadratic functions f(x) can also be
expressed in factored form - Example. Find the zeros of f(x) x2x 6. Set
f(x) 0 and solve for x. We have x2x 6 0.
We next express f(x) in factored form, so it will
be easy to find the zeros.
The zeros are x 3 and x 2. Note that these
are the values r and s from the factored form.
27
Finding a formula for a parabola using the
factored form
- Example. Suppose the points (0, 6), (1, 0), and
(3, 0) are on a parabola, as in a previous
example. Find a formula for the parabola using
the factored form. Since the parabola has
x-intercepts at x 1 and x 3, its formula
is Substituting x 0, y
6 gives 6 3a or a 2. Thus, the equation
is If we multiply this out, we
get y 2x28x6, which is the same result as
before.
28
Two methods for finding the zeros of a quadratic
- The first method involves completing the square.
Suppose we want the roots of x2 3x 2 0. If
we complete the square as before, we get (x
1.5)2 0.25 0. If we rewrite this as (x
1.5)2 0.25, we can take the square root of both
sides of the equation to get x 1.5 0.5,
which gives x 1 and x 2. - The other method involves the use of the
quadratic formula, which was presented in a
previous slide lecture. If we apply the
quadratic formula to x2 3x 2 0, we
get This reduces
to x 1.5 0.5 . Again, x 1 and x 2.
29
- What does it mean if a quadratic does not have
real zeros? It means that the graph of the
corresponding parabola does not cross the x-axis. - Problem. If we have 4 feet of string, what is
the rectangle of largest area which we can
enclose with the string? Solution. If we let
one side of the rectangle have length x, then the
other side must have length (42x)/2. That is,
the other side is 2x. Therefore, the area of
the rectangle is a(x) x(2x) x22x. If we
write this in vertex form, we have a(x)
(x1)21. Thus, the vertex is at (1, 1), and
the rectangle of maximum area is a square with a
side length of 1 foot.
30
Summary for Transformation of Functions and their
Graphs
- If y g(x) is a function and k is a constant,
then the graph of y g(x) k is the
graph of y g(x) shifted vertically by k
units. - If y g(x) is a function and k is a constant,
then the graph of y g(xk) is the graph
of y g(x) shifted horizontally by k units. - A function is called an even function if, for all
values of x in the domain of f, f(x) f(x). The
graph of an even function is symmetric across the
y-axis. - A function is called an odd function if, for all
values of x in the domain of f, f(x) f(x).
The graph of an odd function is symmetric about
the origin.
31
Summary for Transformation of Fcts and their
Graphs, contd
- When a function f(x) is replaced by kf(x), the
graph is vertically stretched or compressed and
the average rate of change on any interval is
also multiplied by k. If k is negative, a
vertical reflection about the x-axis is also
involved. - When a function f(x) is replaced by f(kx), the
graph is horizontally stretched or compressed by
a factor of 1/k and, if k lt 0, reflected
horizontally about the y-axis. - A quadratic function has a formula in either
standard form or vertex form. Completing the
square converts standard to vertex form. Vertex
form is used to find the max or min value of the
quadratic function. A quadratic function has 0,
1, or 2 real zeros. If a quadratic function has
real zeros, it can also be represented in
factored form. Methods for finding the formula
for a quadratic function from given data points
were discussed.
Recommended
CrystalGraphics Presentations


