
AA DD Model PowerPoint PPT Presentation
1 / 10
Title: AA DD Model
1
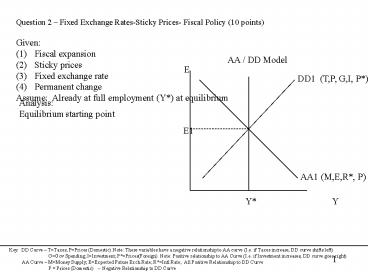
- Question 2 Fixed Exchange Rates-Sticky Prices-
Fiscal Policy (10 points) - Given
- Fiscal expansion
- Sticky prices
- Fixed exchange rate
- Permanent change
- Assume Already at full employment (Y) at
equilibrium
AA / DD Model
E
DD1 (T,P, G,I, P)
Analysis Equilibrium starting point
E1
AA1 (M,E,R, P)
Y Y
Key DD Curve TTaxes PPrices (Domestic)
Note These variables have a negative
relationship to AA curve (I.e. if Taxes increase,
DD curve shifts left)
GGov Spending IInvestment
PPrices(Foreign) Note Positive relationship
to AA Curve (I.e. if Investment increases, DD
curve goes right) AA Curve MMoney
Supply EExpected Future Exch.Rate RIntl
Rate All Positive Relationship to DD Curve
P Prices (Domestic)
-- Negative Relationship to DD Curve
2
- Question 2 Fixed Exchange Rates-Sticky Prices-
Fiscal Policy (10 points) - Given
- Fiscal expansion
- Sticky prices
- Fixed exchange rate
- Permanent change
- Assume Already at full employment (Y) at
equilibrium
AA / DD Model
E
DD1 (T,P, G,I, P)
DD2 (G )
Analysis Short-term impact on AA/DD model Step
1 If government spending increases then the DD1
curve shifts out to DD2 This stimulates the
economy to Y2 and leads to an appreciation of the
currency to E2 Since the exchange rate is
supposed to be fixed, the central bank intervenes
to depreciate the currency by buying official
international reserves (OIR) with local currency
which is like increasing the money supply.
E1
E2
AA1 (M,E,R, P)
Assets Liabilities
OIR High-powered money (H)
(also equivalent to an
increase Domestic credit in money supply
(M)) (I.e. treasury bonds)
Y Y
Y2
Key DD Curve TTaxes PPrices (Domestic)
Note These variables have a negative
relationship to AA curve (I.e. if Taxes increase,
DD curve shifts left)
GGov Spending IInvestment
PPrices(Foreign) Note Positive relationship
to AA Curve (I.e. if Investment increases, DD
curve goes right) AA Curve MMoney
Supply EExpected Future Exch.Rate RIntl
Rate All Positive Relationship to DD Curve
P Prices (Domestic)
-- Negative Relationship to DD Curve
3
- Question 2 Fixed Exchange Rates-Sticky Prices-
Fiscal Policy (10 points) - Given
- Fiscal expansion
- Sticky prices
- Fixed exchange rate
- Permanent change
- Assume Already at full employment (Y) at
equilibrium
AA / DD Model
E
DD1 (T,P, G,I, P)
DD2 (G )
Analysis Short-term impact on AA/DD model Step
2 Since money supply (M) has increased, The AA1
curve shifts out to AA2 and the economy moves out
to Y3.
E1/
E3
E2
AA2 (M )
If an economy is already at full
employment, fiscal expansion will lead to an
overheated economy in the short-term under a
fixed-rate regime
AA1 (M,E,R, P)
Y Y2 Y
Y3
Key DD Curve TTaxes PPrices (Domestic)
Note These variables have a negative
relationship to AA curve (I.e. if Taxes increase,
DD curve shifts left)
GGov Spending IInvestment
PPrices(Foreign) Note Positive relationship
to AA Curve (I.e. if Investment increases, DD
curve goes right) AA Curve MMoney
Supply EExpected Future Exch.Rate RIntl
Rate All Positive Relationship to DD Curve
P Prices (Domestic)
-- Negative Relationship to DD Curve
4
- Question 2 Fixed Exchange Rates-Sticky Prices-
Fiscal Policy (10 points) - Given
- Fiscal expansion
- Sticky prices
- Fixed exchange rate
- Permanent change
- Assume Already at full employment (Y) at
equilibrium
AA / DD Model
E
DD2 (G )
Analysis Long-term impact on AA/DD model Step 2
(Sticky price adjustment) Over the long-term,
prices will adjust upwards. How? As government
spending increases, its consumption often
consists of non-tradeables. Prices of
non-tradeables will go up causing a real exchange
rate appreciation. P (tradeables)
RER P (non-tradeables)
E1/
E3
E2
AA2 (M )
Y Y3 Y
Key DD Curve TTaxes PPrices (Domestic)
Note These variables have a negative
relationship to AA curve (I.e. if Taxes increase,
DD curve shifts left)
GGov Spending IInvestment
PPrices(Foreign) Note Positive relationship
to AA Curve (I.e. if Investment increases, DD
curve goes right) AA Curve MMoney
Supply EExpected Future Exch.Rate RIntl
Rate All Positive Relationship to DD Curve
P Prices (Domestic)
-- Negative Relationship to DD Curve
5
- Question 2 Fixed Exchange Rates-Sticky Prices-
Fiscal Policy (10 points) - Given
- Fiscal expansion
- Sticky prices
- Fixed exchange rate
- Permanent change
- Assume Already at full employment (Y) at
equilibrium
AA / DD Model
E
DD3 (P )
DD2
Analysis Long-term impact on AA/DD model Step 2
(Sticky price adjustment) Since prices (P) are
a function of both the DD and AA curves, as
prices go up the DD and AA curves will shift
back to Y
E1/
E3
E2
AA2
In the long-run, fiscal expansion is
ineffective stimulating the economy
AA3 (P )
Y Y3 Y
Key DD Curve TTaxes PPrices (Domestic)
Note These variables have a negative
relationship to AA curve (I.e. if Taxes increase,
DD curve shifts left)
GGov Spending IInvestment
PPrices(Foreign) Note Positive relationship
to AA Curve (I.e. if Investment increases, DD
curve goes right) AA Curve MMoney
Supply EExpected Future Exch.Rate RIntl
Rate All Positive Relationship to DD Curve
P Prices (Domestic)
-- Negative Relationship to DD Curve
6
- Question 2 Fixed Exchange Rates-Sticky Prices-
Fiscal Policy (10 points) - Given
- Fiscal expansion
- Sticky prices
- Fixed exchange rate
- Permanent change
- Assume Already at full employment (Y) at
equilibrium
ISLM-BP Model
R
LM1 (M, P)
Analysis Equilibrium starting point
RR
BP
IS1 (C,I,G,CA)
Y Y
Key LM Curve PPrices (Domestic) Note
Price has a negative relationship to LM curve
(I.e. if P increases,LM curve shifts left)
MMoney Supply Note
Money supply has a positive relationship to LM
Curve (I.e. if M increases, LM curve goes right)
IS Curve CConsumption IInvestment (
a function of RRate (domestic), GGovt
Spending, CACurrent Acct All Positive
Relationship to IS Curve BP Curve- R
Rate (Domestic), RRate (Intl)
7
- Question 2 Fixed Exchange Rates-Sticky Prices-
Fiscal Policy (10 points) - Given
- Fiscal expansion
- Sticky prices
- Fixed exchange rate
- Permanent change
- Assume Already at full employment (Y) at
equilibrium
ISLM-BP Model
R
LM1 (M, P)
Analysis Short-term impact on ISLM model Step 1
If government spending increases then the IS1
curve shifts out to IS2 This stimulates the
economy to Y2 but RR This leads to capital
inflows which will cause an appreciation of the
local currency. Why? Ee E
(Interest Rate Parity Condition) 1R -R The
central bank will intervene by buying OIR
RR
RR
BP
IS2 (G )
IS1 (C,I,G,CA)
Assets Liabilities
OIR High-powered money (H)
(also equivalent to an
increase Domestic credit in money supply
(M)) (I.e. treasury bonds)
Y Y
Y2
Key LM Curve PPrices (Domestic) Note
Price has a negative relationship to LM curve
(I.e. if P increases,LM curve shifts left)
MMoney Supply Note
Money supply has a positive relationship to LM
Curve (I.e. if M increases, LM curve goes right)
IS Curve CConsumption IInvestment (
a function of RRate (domestic), GGovt
Spending, CACurrent Acct All Positive
Relationship to IS Curve BP Curve- R
Rate (Domestic), RRate (Intl)
8
- Question 2 Fixed Exchange Rates-Sticky Prices-
Fiscal Policy (10 points) - Given
- Fiscal expansion
- Sticky prices
- Fixed exchange rate
- Permanent change
- Assume Already at full employment (Y) at
equilibrium
ISLM-BP Model
R
LM1 (M, P)
LM2 (M )
Analysis Short-term impact on ISLM model Step 1
Since money supply (M) has increased, The LM1
curve shifts out to LM2 and the economy moves out
to Y3
RR
BP
RR
If an economy is already at full
employment, fiscal expansion will lead to an
overheated economy in the short-term under a
fixed-rate regime
IS2 (G )
IS1 (C,I,G,CA)
Y Y2 Y
Y3
Key LM Curve PPrices (Domestic) Note
Price has a negative relationship to LM curve
(I.e. if P increases,LM curve shifts left)
MMoney Supply Note
Money supply has a positive relationship to LM
Curve (I.e. if M increases, LM curve goes right)
IS Curve CConsumption IInvestment (
a function of RRate (domestic), GGovt
Spending, CACurrent Acct All Positive
Relationship to IS Curve BP Curve- R
Rate (Domestic), RRate (Intl)
9
- Question 2 Fixed Exchange Rates-Sticky Prices-
Fiscal Policy (10 points) - Given
- Fiscal expansion
- Sticky prices
- Fixed exchange rate
- Permanent change
- Assume Already at full employment (Y) at
equilibrium
ISLM-BP Model
R
LM1 (M, P)
LM2 (M )
Analysis Long-term impact on ISLM model Step 2
(Sticky price adjustment) Over the long-term,
prices will adjust upwards. How? As government
spending increases, its consumption often
consists of non-tradeables. Prices of
non-tradeables will go up causing a real exchange
rate appreciation. P (tradeables)
RER P (non-tradeables)
BP
RR
IS2 (G )
IS1 (C,I,G,CA)
Y Y2 Y
Y3
Key LM Curve PPrices (Domestic) Note
Price has a negative relationship to LM curve
(I.e. if P increases,LM curve shifts left)
MMoney Supply Note
Money supply has a positive relationship to LM
Curve (I.e. if M increases, LM curve goes right)
IS Curve CConsumption IInvestment (
a function of RRate (domestic), GGovt
Spending, CACurrent Acct All Positive
Relationship to IS Curve BP Curve- R
Rate (Domestic), RRate (Intl)
10
- Question 2 Fixed Exchange Rates-Sticky Prices-
Fiscal Policy (10 points) - Given
- Fiscal expansion
- Sticky prices
- Fixed exchange rate
- Permanent change
- Assume Already at full employment (Y) at
equilibrium
ISLM-BP Model
R
LM3 (P )
LM2
Analysis Long-term impact on AA/DD model Step 2
Due to an increase in prices (P), the LM2 curve
will shift back to LM3. Because the RER has
appreciated, this means that locally produced
goods are more expensive the foreign goods hence
our exports drop and imports increase which
worsens the Current Account (CA) When the CA
decreases, the IS2 curve shifts back to IS3
BP
RR
IS2
IS3 (CA )
Y3 Y
Y
In the long-run, fiscal expansion is
ineffective stimulating the economy in the
ISLM-BP model
Key LM Curve PPrices (Domestic) Note
Price has a negative relationship to LM curve
(I.e. if P increases,LM curve shifts left)
MMoney Supply Note
Money supply has a positive relationship to LM
Curve (I.e. if M increases, LM curve goes right)
IS Curve CConsumption IInvestment (
a function of RRate (domestic), GGovt
Spending, CACurrent Acct All Positive
Relationship to IS Curve BP Curve- R
Rate (Domestic), RRate (Intl)
Recommended
