
Integrated Circuits Costs PowerPoint PPT Presentation
1 / 20
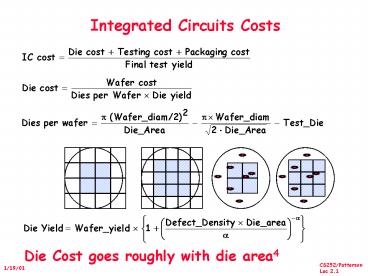
Title: Integrated Circuits Costs
1
Integrated Circuits Costs
Die Cost goes roughly with die area4
2
Real World Examples
- Chip Metal Line Wafer Defect Area Dies/ Yield Di
e Cost layers width cost
/cm2 mm2 wafer - 386DX 2 0.90 900 1.0 43 360 71 4
- 486DX2 3 0.80 1200 1.0 81 181 54 12
- PowerPC 601 4 0.80 1700 1.3 121 115 28 53
- HP PA 7100 3 0.80 1300 1.0 196 66 27 73
- DEC Alpha 3 0.70 1500 1.2 234 53 19 149
- SuperSPARC 3 0.70 1700 1.6 256 48 13 272
- Pentium 3 0.80 1500 1.5 296 40 9 417
- From "Estimating IC Manufacturing Costs, by
Linley Gwennap, Microprocessor Report, August 2,
1993, p. 15
3
Cost/PerformanceWhat is Relationship of Cost to
Price?
- Component Costs
- Direct Costs (add 25 to 40) recurring costs
labor, purchasing, scrap, warranty - Gross Margin (add 82 to 186) nonrecurring
costs RD, marketing, sales, equipment
maintenance, rental, financing cost, pretax
profits, taxes - Average Discount to get List Price (add 33 to
66) volume discounts and/or retailer markup
List Price
25 to 40
Avg. Selling Price
34 to 39
6 to 8
Direct Cost
15 to 33
4
Chip Prices (August 1993)
- Assume purchase 10,000 units
Chip Area Mfg. Price Multi- Comment mm2 cost pli
er 386DX 43 9 31 3.4 Intense
Competition 486DX2 81 35 245 7.0 No
Competition PowerPC 601 121 77 280 3.6 DEC
Alpha 234 202 1231 6.1 Recoup
RD? Pentium 296 473 965 2.0 Early in
shipments
5
Summary Price vs. Cost
6
CS 252 Course Focus
- Understanding the design techniques, machine
structures, technology factors, evaluation
methods that will determine the form of computers
in 21st Century
Parallelism
Technology
Programming
Languages
Applications
Interface Design (ISA)
Computer Architecture Instruction Set
Design Organization Hardware/Software Boundary
Compilers
Operating
Measurement Evaluation
History
Systems
7
Topic Coverage
- Textbook Hennessy and Patterson, Computer
Architecture A Quantitative Approach, 3rd Ed.,
2001 - Research Papers -- Handed out in class
- 1 week Review Fundamentals of Computer
Architecture (Ch. 1), Pipelining, Performance,
Caches, Virtual Memory, Cost, Ics - 1 week Memory Hierarchy (Chapter 5)
- 2 weeks Fault Tolerance, Queuing Theory,
Input/Output and Storage (Ch. 6) - 2 weeks Networks and Clusters (Ch. 7)
- 2 weeks Multiprocessors (Ch. 8)
- 2 weeks Instruction Sets, DSPs, SIMD (Ch. 2),
Vector Processors (Appendix B). - 1 week Dynamic Execution. (Ch 3)
- 1 week Static Execution. (Ch 4)
- Rest Project stategy meetings, presentations,
quizzes
8
Original
Big Fishes Eating Little Fishes
9
1988 Computer Food Chain
Mainframe
PC
Work- station
Mini- computer
Mini- supercomputer
Supercomputer
Massively Parallel Processors
10
1998 Computer Food Chain
Mini- supercomputer
Mini- computer
Massively Parallel Processors
Mainframe
PC
Work- station
Server
Now who is eating whom?
Supercomputer
11
Why Such Change in 10 years?
- Performance
- Technology Advances
- CMOS VLSI dominates older technologies (TTL, ECL)
in cost AND performance - Computer architecture advances improves low-end
- RISC, superscalar, RAID,
- Price Lower costs due to
- Simpler development
- CMOS VLSI smaller systems, fewer components
- Higher volumes
- CMOS VLSI same dev. cost 10,000 vs. 10,000,000
units - Lower margins by class of computer, due to fewer
services - Function
- Rise of networking/local interconnection
technology
12
Technology Trends Microprocessor Capacity
Graduation Window
Alpha 21264 15 million Pentium Pro 5.5
million PowerPC 620 6.9 million Alpha 21164 9.3
million Sparc Ultra 5.2 million
Moores Law
- CMOS improvements
- Die size 2X every 3 yrs
- Line width halve / 7 yrs
13
Memory Capacity (Single Chip DRAM)
year size(Mb) cyc time 1980 0.0625 250
ns 1983 0.25 220 ns 1986 1 190 ns 1989 4 165
ns 1992 16 145 ns 1996 64 120 ns 2000 256 100
ns
14
Technology Trends(Summary)
Capacity Speed (latency) Logic 2x in 3
years 2x in 3 years DRAM 4x in 3-4 years 2x
in 10 years Disk 4x in 2-3 years 2x in 10 years
15
Processor PerformanceTrends
1000
Supercomputers
100
Mainframes
10
Minicomputers
Microprocessors
1
0.1
1965
1970
1975
1980
1985
1990
1995
2000
Year
16
Processor Performance(1.35X before, 1.55X now)
1.54X/yr
17
Performance Trends(Summary)
- Workstation performance (measured in Spec Marks)
improves roughly 50 per year (2X every 18
months) - Improvement in cost performance estimated at 70
per year
18
Moores Law Paper
- Discussion
- What did Moore predict?
- 35 years later, how did it hold up?
- In your view, what was biggest surprise in paper?
19
Review 3/3 TLB, Virtual Memory
- Caches, TLBs, Virtual Memory all understood by
examining how they deal with 4 questions 1)
Where can block be placed? 2) How is block found?
3) What block is repalced on miss? 4) How are
writes handled? - Page tables map virtual address to physical
address - TLBs make virtual memory practical
- Locality in data gt locality in addresses of
data, temporal and spatial - TLB misses are significant in processor
performance - funny times, as most systems cant access all of
2nd level cache without TLB misses! - Today VM allows many processes to share single
memory without having to swap all processes to
disk today VM protection is more important than
memory hierarchy
20
Summary
- Performance Summary needs good benchmarks and
good ways to summarize performancfe - Transistors/chip for microprocessors growing via
Moores Law 2X 1.5/yrs - Disk capacity (so far) is at a faster rate last
4-5 years - DRAM capacity is at a slower rate last 4-5 years
- In general, Bandwidth improving fast, latency
improving slowly
Recommended
