
The mean PowerPoint PPT Presentation
1 / 46
Title: The mean
1
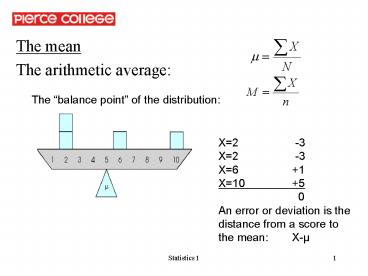
- The mean
- The arithmetic average
The balance point of the distribution
X2 -3 X2 -3 X6 1 X10 5 0 An error
or deviation is the distance from a score to the
mean X-µ
2
- The sum of the errors or deviations around the
mean is always 0. - Advantage More informative than median mode
- Takes all the observation/scores into account.
- Takes the distance direction of
deviations/errors into account.
3
- Advantage More uses than median mode
- Necessary for calculating many inferential
statistics. - Limitation Not always possible to calculate a
mean (scale) - Mean can only be calculated for interval/ratio
level data - Need a different measure for nominal or ordinal
level data
4
- Limitation Not always appropriate to use the
mean to describe the middle of a distribution
(distribution) - Mean is sensitive to extreme values or
outliers - Mean does not always reflect where the scores
pile up - Need a different measure for asymmetrical
distributions - Use the mean for unimodal, symmetrical
distributions of interval/ratio level data.
5
- The median
- Divides the distribution exactly in half 50th
percentile - Odd of scores no pileup or ties at the
middle - median the middle score
6
- Even of scores no pileup or ties at the
middle - median the average of the 2 middle scores
7
- Advantage Insensitive to extreme values
- Can be used when extreme values distort the mean
- 3, 5, 5, 6, 7, 8, 9 median6 mean 6.1
- 3, 5, 5, 6, 7, 8, 50 median6 mean12
- Is the most central, representative value in
skewed distributions - Advantage Can be calculated when the mean cannot
- Can be used with ranks (as well as interval/ratio
data) - Can be used with open-ended distributions
- Example of siblings (5 siblings?)
8
- Limitation Not as informative as the mean
- Takes only the observations/scores around the
50th ile into account. - Provides no information about distances between
observations. - Limitation Fewer uses than the mean
- Median is purely descriptive.
9
- Limitation Not always possible to calculate a
median (scale) - Median can only be calculated for ordinal
interval/ratio data - Use the median when you cannot calculate a mean
or when the distributions of interval/ratio data
are skewed by extreme values.
10
- The mode
- The most frequently occurring score(s)
- Advantage Simple to find
mode coke
11
- Advantage Can be used with any scale of
measurement - Median can only be calculated for ordinal
interval/ratio data - Mean can only be calculated for interval/ratio
data - Advantage Can be used to indicate gt1 most
frequent value - Use to indicate bimodality, multimodality
12
M 5 median 5 Neither reflects where the
scores actually pile up. Modes 2 8.
13
Use to indicate major minor modes
major mode 6am minor mode 6pm
14
- Limitation Not as informative as the mean or
median - Takes only the most frequently observed X values
into account. - Provides no information about distances between
observations or the of observations
above/below the mode. - Limitation Fewer uses than the mean
- Mode is purely descriptive.
- Need to calculate a mean to use with inferential
statistics. - Use the mode when you cannot compute a mean or
median, or with the mean/median to describe a
bimodal/multimodal distribution.
15
- Describing distributions Measures of variability
or dispersion - To describe/summarize a distribution of scores
efficiently, you need - A measure of central tendency a measure of
variability. - Which measure of central tendency is most
appropriate? Why?
16
- Central tendency variability measures are
partners. - Mode ?range
- Median ?interquartile range, semi-interquartile
range - Mean ?SS, variance (s²or s² ), standard deviation
(s or s) - These measures describe distributions indicate
how well individual scores or samples of scores
represent the population.
17
- Variability measures used with the mode median
- Range
- Based on the distance between the highest
lowest observations on the X scale. - Only takes the 2 most extreme observations into
account.
18
- For interval/ratio data, range
highest score lowest score 1 11 - 2 1
10 OR URL X max LRL X min 11.5 - 1.5 10
19
- Range can also be used for ordered categories
- Range from agree to disagree strongly, with
modal response disagree. - The range is typically used with the mode, when
the mean median are inappropriate or impossible
to calculate (but may be reported along with a
median or a mean).
20
- Interquartile range (IQR) semi-interquartile
range (SIQR) - Based on distances between scores corresponding
to percentiles on the X scale. - Only take the middle 50 of the distribution
into account. - Use only with interval/ratio data.
- Interquartile range distance between 1st 3rd
quartiles - IQR Q3 - Q1
- 1st quartile Q1 is the score at the 25th
percentile - 2nd quartile Q2 is the score at the 50th
percentilethe median - 3rd quartile Q3 is the score at the 75th
percentile
21
- IQR provides information about how much distance
on the X scale covers or contains the middle 50
of the distribution.
22
- N
- Q1
- Q3
- IQR
- SIQR
- Semi-Interquartile range half the interquartile
range - SIQR
- For a symmetrical distribution, SIQR tells you
the distance from the median up to Q3 or down to
Q1the distance covering the 25 of the
distribution to each side of the median. - The interquartile range semi-interquartile
range are typically used with the median (but may
be reported along with a mean).
23
- Variability measures used with the mean
- SS, variance standard deviation are based on
distances between each of the scores the mean
on the X scale. - All scores are taken into account, as with the
mean. - Use only with interval/ratio data.
- Most useful for symmetrical distributions, when
the mean is the best measure of central tendency.
24
For now, we will be working with the population
values.
25
- Suppose you want to summarize how far the scores
in a distribution typically deviate from the
mean. - Averages are a convenient way to summarize
information, BUT - REMEMBER An error or deviation is the distance
from a score to the mean - X- µ
- REMEMBER The sum of the deviations around the
mean is always 0.
26
- You cant sum the deviations divide by the
number of scores to get a useful average amount
of deviation 0/N will always 0. - What can you do to summarize the deviations?
SS the sum of the squared deviations or errors
around the mean
(definitional formulaconceptual) Squaring the
deviations first allows you to sum them.
27
- Computing, squaring, summing all N deviations
is tedious, so there is a shortcut. - Plug these values into the following formula
- (computational formulause this one)
- For the distribution of N4,
- ?X 8 ?X² 38
28
- Computing, squaring, summing all N deviations
is tedious, so there is a shortcut. - Plug these values into the following formula
- (computational formulause this one)
- For the distribution of N4,
- ?X 8 ?X² 38
- SS
29
- So, what does __ tell you about the variability
of the distribution of scores? - By itself, not much
- SS summarizes the amount of deviation is useful
for further analyses. - In general, we CAN say that
30
- As variability increases (more differences
between scores, larger deviations) SS gets
larger. - Extreme scores farther from µ contribute
proportionately more to SS because they produce
larger deviations. - As N increases (more squared deviations to sum)
SS gets larger. - Because SS increases with N, SS is NOT a good
descriptive statistic - You cant compare SS between groups of different
sizes.
31
- How can you use SS to create a measure that will
allow you to compare different-sized groups?
32
- How can you use SS to create a measure that will
allow you to compare different-sized groups? - Variance the average squared deviation or mean
squared deviation - Variance is not affected by N, because it is an
averagethe mean squared deviation. - Variance summarizes the amount of deviation,
allows for comparisons between different-sized
groups, is useful for further analyses. - Since variance is a mean of squared deviations,
it is not on the same scale as our original
variable
33
- Because variance does NOT allow you to describe
typical variation among scores in terms of the
original scale, it is still NOT a good
descriptive statistic. - The relationship between variance distances or
units on the I/E scale is difficult to visualize
or understand. - How can you use ?² to create a descriptive
measure of variability on the same scale as the
original scores? - SSthe sum of the squared deviations ?(X-?)²
- ?²the average squared deviation SS/N
- What wed really like to have is a measure of the
typical or average deviation from the mean that
is NOT based on squared quantities.
34
- Standard deviation the typical or expected
deviation - The typical, average, or expected distance that
scores deviate from the mean. - population s.d.
- Taking the square root of the variance returns
the measure of variability to the original units
of measurement. - This allows you to represent standard deviation
as a distance on the X axis. - This also allows you to make statements about
how extreme or unusual an observation is.
35
- Note As with the mean, standard deviation is
most useful for describing symmetrical
distributions. - Standard deviation is the best descriptive
measure of variability around a mean SS
variance are important concepts for understanding
for use in further analyses.
36
- Sample variance standard deviation
- We often want to make statements about population
parameters. - How extroverted are male U.S. citizens, on
average? - Parameter of interest µ .
- BUT, much of the time we only have access to
sample statistics. - How extroverted are males from the PSY 1 subject
pool, on average? - Our best estimate of µ M calculated using
sample data.
37
We use statistics s s² as estimates of s s²
when the population parameters are unknown.
38
- Formulae
39
- Sample population SS are the same
- Calculations do NOT change from population to
sample. - Population Sample
- N has just been relabeled as n.
- If you use the definitional formula, use the
correct mean. - Population Sample
- This will matter later on
40
- Comparing sample population variances
- Calculations DO change from population to sample.
- Population Sample
- N has been relabeled as n.
- AND
- Use n-1 instead of N in the denominator.
- Sample formula will always yield a larger value.
41
- Why (n-1) instead of N?
- Because (n-1) instead of N corrects for bias in
calculating s s². - Remember Sample statistics are only useful to
the extent that they provide unbiased estimates
of population parameters. - What is an unbiased statistic?
42
- One that on average the population parameter.
- M is an unbiased estimate of ? The average of
many sample means the population mean.
(Each box is a sample mean.) What is a biased
statistic? One that systematically over or
underestimates the parameter.
43
- SS/N tends to underestimate population variance
when using sample data. - Why doesnt the SS/N formula work with sample
data? - Samples usually contain less variability than the
populations they come from.
Samples tend to contain observations from the
center of the population distribution. These
samples do not reflect the extremes of the
population, so we underestimate the true
variability.
44
- Dividing SS by a smaller number corrects for the
tendency to underestimate true population
variability. - The n-1 correction makes s² s unbiased
estimators of s² s . - n-1 is also referred to as degrees of freedom.
- Sample variances have n-1 degrees of
freedomthey are calculated from n-1 independent
scores. - The last score is determined by the other scores
by M.
45
- For the following set of data, compute the value
for SS. - Scores 5, 2, 2, 7, 9
- ANS SS
- Calculate the variance and the standard deviation
for the following date (Population Sample) - Scores 2, 3, 2, 4, 7, 5, 3, 6, 4
46
- Data
SS s² s s² s
Recommended
