
National Convective Weather Forecast Product PowerPoint PPT Presentation
1 / 12
Title: National Convective Weather Forecast Product
1
National Convective Weather Forecast Product
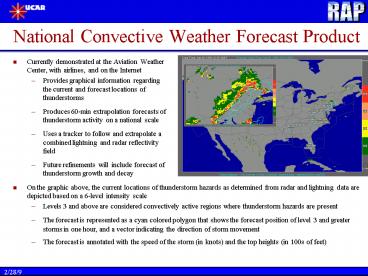
- Currently demonstrated at the Aviation Weather
Center, with airlines, and on the Internet - Provides graphical information regarding the
current and forecast locations of thunderstorms - Produces 60-min extrapolation forecasts of
thunderstorm activity on a national scale - Uses a tracker to follow and extrapolate a
combined lightning and radar reflectivity field - Future refinements will include forecast of
thunderstorm growth and decay
- On the graphic above, the current locations of
thunderstorm hazards as determined from radar and
lightning data are depicted based on a 6-level
intensity scale - Levels 3 and above are considered convectively
active regions where thunderstorm hazards are
present - The forecast is represented as a cyan colored
polygon that shows the forecast position of level
3 and greater storms in one hour, and a vector
indicating the direction of storm movement - The forecast is annotated with the speed of the
storm (in knots) and the top heights (in 100s of
feet)
2
Convective Hazard Detection
Radar
Lightning Rate
- Radar
- Unisys - VIL and Echo Tops National Mosaics
- Echo Tops allows removal of AP and ground
clutter - Lightning
- Global Atmospherics
- Lightning provides
- More timely product
- Radar is 10 to 25 min old
- Lightning is
- Highlights updraft regions
- Fills in regions of radar data voids or latency
Detection Field and Forecast
3
Extrapolation Forecast
- Eliminate Stratiform
- Stratiform-Convective Partitioner
- Steiner and Houze (1995)
- Remove perishable scales
- Wilson 1966
- Elliptical filter -
- Wolfson 1999 (15B.1 Thursday 400 pm
The FAA Terminal Convective Weather Forecast
Product Scale Separation Filter Optimization) - Determine motion vectors
- Dual-threshold cell tracker
- Dixon and Weiner (1993)
4
NCWF Summer 1999 Evaluations
- Tech Center usability study at Comair and Delta
- Comair
- Baseline - June 1-3
- Training at NCAR - June 7
- Training at Comair - June 14-17
- Delta
- Training - Late June
- Usability study July and Aug
- AGFS - RTVS
- June through August
- Currently sending data to FSL in real-time
- Internal validation
5
(No Transcript)
6
(No Transcript)
7
(No Transcript)
8
(No Transcript)
9
Notes on verification statistics
- Different scores measure different things
- CSI H / (M H F)
- Measures relative accuracy
- TSS PODy PODn -1
- Measures discrimination between Yes and No
observations - PODy
- Measures proportion of convective area that is
correctly forecast to have convection - PODn
- Measures proportion of non-convective area that
is correctly forecast to not have convection - FAR
- Measures proportion of forecast convective area
that is incorrect - Bias
- Measures the extent of over- or under-
forecasting
- H Hits
- M Misses
- F False Alarms
- PODy H / (H M)
- PODn proportion of No area that was correctly
forecast to be No - FAR F / (H F)
- Bias (F H) / (M H)
10
NCWF Verification notes
- Independent verification provided by Real-Time
Verification System (RTVS), FSL/NOAA and NCAR
verification groups, summer of 1999 - http//www-ad.fsl.noaa.gov/afra/rtvs/convective/ma
in_convective.html - Observations based on national convective
detection product (NCDP) over 10 minutes prior to
forecast valid time - 20-km grid used as basis for verification
- Observations on a 4-km grid
- Filter At least 12 (50) 4-km boxes within a
20-km box must have a convective observation in
order for the 20-km box to count as a Yes
observation - Verification approach is demanding - it
strictly requires overlap of forecasts and
observations (i.e., no slop allowed for
getting close!) - Results are consistent with previous studies of
these types of evaluations
11
Example 4 June1999, 00 UTC
12
4 June 1999Forecasts valid at 0000 UTC
Area efficiency (PODy / Area) x 100
Recommended
