
Tufte PowerPoint PPT Presentation
1 / 9
Title: Tufte
1
Tufte
2
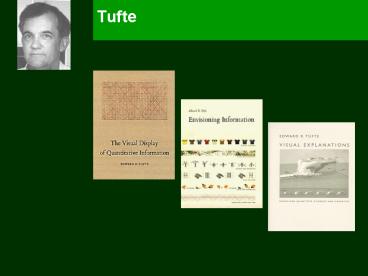
The Visual Display of Quantitative Information
(1983)
- Graphical Practice
- graphical excellence
- graphical integrity
- Theory of Data Graphics
- data-ink and graphical redesign
- chartjunk vibrations, grids, and ducks
- data-ink maximization and graphical design
- multifunctioning graphical elements
- data density and small multiples
- aesthetics and technique in data graphical design
3
The Visual Display of Quantitative Information
(1983)
- Graphical Excellence
- that which gives the viewer the greatest number
of ideas in the shortest time with the least ink
in the smallest space
4
The Visual Display of Quantitative Information
(1983)
- Graphical Integrity
- representation of numbers should be directly
proportional to the numerical quantities
represented - clear, detailed, and thorough labeling should be
used to defeat graphical distortion and ambiguity - show data variation, not design variation
- graphics must not quote out of context
- Graphical elegance is found
- in simplicity of design
- and complexity of data
5
Tufte's Rules, after Casselman, abridged
http//www.ams.org/new-in-math/cover/visual1.html
- Tone down secondary elements of a picture layer
the figure to produce a visual hierarchy. - Replace coded labels in the figure by direct
ones. - Produce emphasis by using the smallest possible
effective distinctions. - Eliminate all unnecessary parts of a figure.
- Use small multiples numerous repetitions of a
single figure with slight variations. - Make the graphics carry a story.
6
Envisioning Information (1990)
- Escaping Flatland
- Micro/Macro Readings
- Layering and Separation
- Small Multiples
- Color and Information
- Narratives of Space and Time
7
Visual Explanations Images and Quantities,
Evidence, and Narrative (1997)
- Images and Quantities
- Visual and Statistical Thinking Displays of
Evidence for Making Decisions - Explaining Magic Pictorial Instructions and
Disinformation Design - The Smallest Effective Distance
- Parallelism Repetition and Change, Comparison
and Change - Multiples in Space and Time
- Visual Confections Juxtapositions form the Ocean
of the Streams of Story
8
Dense Information and Computers
9
Dense Information and Computers
Recommended
