
John Kappenman PowerPoint PPT Presentation
1 / 26
Title: John Kappenman
1
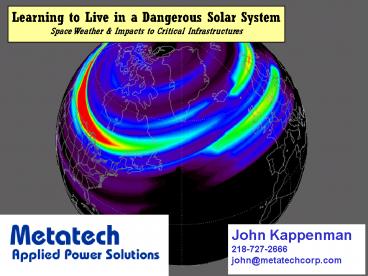
Learning to Live in a Dangerous Solar
System Space Weather Impacts to Critical
Infrastructures
John Kappenman 218-727-2666 john_at_metatechcorp.com
2
Space Weather from the Sun to the Power Grid
- What are Important Issues for Power Grids
- Space Weather Forecasting?
- Space Weather a growing concern as National
Security Public Services reliance on Impacted
Systems increases significantly - Space Weather at Earth is very dynamic can
erupt rapidly, on a planetary scale within a few
minutes - At a Technology Cusp Space Weather support
moving from a Monitoring Service to a
Predictive Service.
3
(No Transcript)
4
(No Transcript)
5
An Overview of Cycle 23 GIC Risks for Power
Grids
Sunspot Cycle 19 most Grid Infrastructure
developed after this cycle
Sunspot Cycle 17
Sunspot Cycle 23 at Mid-Point
6
An Overview of Cycle 23 GIC Risks for Power
Grids
Geomagnetic Storm Activity cycle is not as
pronounced as sunspot cycle
7
March 13-14, 1989
August 4-5, 1972
July 13-14, 1982
Great Storms in Declining Phase of Cycle 17
8
Resulting in Rapid Growth Phase of Global
Auroral Patterns
These convections patterns play a role in
determining the dynamics and extent of
the equatorward boundaries of the Aurora and
Electrojet Currents
Courtesy SOHO (ESA/NASA)
9
Comparisons of Terrestrial Weather Space Weather
Solar X-Ray Energy at Earth Factor of 10,000
Times Increase Within matter of Several Minutes
Temperatures Duluth -60oF to 100oF Seasonal
Change
Wind Speeds 100 mph
Solar Wind Speeds 2 million mph
Geographic Extent Thunderstorms Hurricanes
several State spread
Geographic Extent Geomagnetic Storms Planetary
Scale
Storm Development Thermodynamics of Heat/Moisture
in Atmosphere Days to develop
Storm Development Electromagnetic Processes that
can be nearly instantaneous
10
(No Transcript)
11
Magnetic Storms Ground Induction Process
Electrojet Field Disturbances Couple to Power
Systems
Storms have Continent-Wide Footprints
12
GIC in Transformers The Root Cause of All Power
Grid Problems
- Transformers easily Saturuate with even minor
levels of GIC - Storms cause problems in hundreds to thousands
of transformers at the same time
Saturated
13
(No Transcript)
14
Power Grid Vulnerability to Space Weather A
GROWING PROBLEM
Large HV Transformers are more vulnerable
The Antenna to Disturbances has grown over time
Cycle 22
Cycle 19
- New Voltage Regulation Devices Introduce New
Vulnerabilities - Cycle 23 - World-wide Deregulation has Reduced
Transmission Network Reserve Margins
15
The Foot Prints of a Superstorm - March 13, 1989
A Few Minutes of Space Weather that took down
the Quebec Network
16
North American Power Grid Problems Large
Eastward Electrojet March 13, 1989
17
Rapid Growth of Electrojets Collapse of Hydro
Quebec Network March 13, 1989
Time 242-259 EST
Time 1603-1730 EST
18
April 6, 2000 Largest GIC Ever Measured 320 Amps
At Nuclear Plant Southern Sweden
19
Overview on Electric Power Outages and Cost to
Society
- Economic Output is closely Linked to Electric
Energy Production and Sales - The US Gross Domestic Product (GDP) continue to
exhibit similar rates of Growth as increased
Economic Production is fueled by Electric Energy
Usage - Electric Energy Usage provides a very large
Economic Activity Multiplier Effect - Example for Every 1 of Electric Energy Usage
(sales) - Results in 20 to 75 of added GDP in the US
Economy - Economic Analysis for the Societal Costs in
Economic Production (GDP) can be made for various
types, locations and sizes/durations of Electric
Power Disruptions
20
Region Overview San Francisco/Silicon Valley
Area In SanFran/Silicon Valley is 23.5 of
California State Gross Product Or 290
Billion/yr
Cost of Outage (Aggregate for 12 Hour
duration) Range from 203 Million to 1.77
billion in Cost to Regions GDP
this is based upon conservative kwh multipliers
used in US and other world economies (caution,
these multipliers are towards low-end)
21
Region Overview New York City/Manhattan Region
Manhattan Area is 19 of New York State Gross
Product Or 148 Billion/yr
Cost of Outage (Aggregate for 12 Hour
duration) Range from 90 Million to 785
million in Cost to Regions GDP - ExampleNew
York City 1977 Outage Costs were estimated to be
624 million
22
Metatech Applied Power Solutions Division
Operational Impacts Ionospheric Effects
Ionospheric Turbulence
Undisturbed Ionosphere
Scintillation
Ionosphere
- GPS Loss of Lock
- SATCOM Outages
- Radar Interference
- Navigation Errors
Electron Density
Bend Delay
X
Absorb
Apparent Location
True Location
Ionosphere
- Radar Errors
- Geolocation Errors
- GPS Errors
- HF Radio Outages
- Aircraft Communications
23
Operational Impacts Solar Activity Radio
Frequency Interference Effects
- SATCOM Radar RFI occurs when
- Sun in Field of View of the Receiver
- Solar radio burst at appropriate Frequency and
sufficient Intensity
RADAR INTERFERENCE
SATCOM INTERFERENCE
RADIO BURST
- Duration and Frequency of Solar Radio Bursts
- Lasts a few minutes to tens of minutes
- Few events/year during Solar Min
- Hundreds of events/year during Solar Max
- Can Hinder Operational Communication Systems
Cellphones
24
(No Transcript)
25
(No Transcript)
26
Solar Wind Monitoring Provides Advance Warnings
of Sudden Storm Onsets
Courtesy SOHO (ESA/NASA)
Recommended
