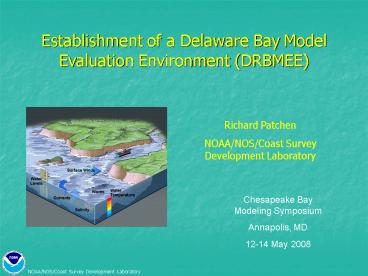
Chesapeake Bay Modeling Symposium PowerPoint PPT Presentation
1 / 34
Title: Chesapeake Bay Modeling Symposium
1
Establishment of a Delaware Bay Model Evaluation
Environment (DRBMEE)
Richard Patchen NOAA/NOS/Coast Survey Development
Laboratory
Chesapeake Bay Modeling Symposium Annapolis,
MD 12-14 May 2008
2
Outline
Introduction Community Models Selection of
Delaware River and Bay Components of MEE Modeling
Strategy Summary of Modeling Evaluations Future
Directions
CheMS08 12-14 May 2008
3
Introduction
NOS/CSDL implementation, vetting, and transition
to Center for Operational Oceanographic Products
and Services (CO-OPS) for operational
status Support Ecosystem modeling needs Coastal
Ocean Modeling Framework Core Community
Models Modeling Accuracy/Skill Standards
CheMS08 12-14 May 2008
4
Community Models
Princeton Ocean Model (POM) Regional Ocean Model
System (ROMS) Finite Volume Coastal Ocean Model
(FVCOM) Advanced Circulation Model
(ADCIRC) Eulerian-Lagrangian Circulation Model
(ELCIRC) and the Semi-implicit Eulerian-Lagrangian
Finite Element Model (SELFE).
CheMS08 12-14 May 2008
5
Selection of Delaware River and Bay (DRB)
Why DRB? Typical of several East Coast
Estuaries, where a tidally dominant system can be
significantly impacted by surges at entrance and
freshwater events Influence of the CD Wide
shelf Availability of a comprehensive data set
(NOS survey 1984-1985) which consisted of 23
water level gages, 45 current meters locations
with multiple depths, and an extensive CTD
program of cast, transects, and time series
stations Future NOS Operational Forecast System
CheMS08 12-14 May 2008
6
Components of MEE
Observations (Historical/Real-time) Bathymetry
and Shoreline Model Initial and Synoptic
Conditions Model Grids Skill Assessment Metrics
CheMS08 12-14 May 2008
7
Historical Observations
NOS Circulation Survey (March 1984-May 1985)
Current Meter Locations/with Conductivity and
Temperature sensors
CheMS08 12-14 May 2008
8
Historical Observations
NOS Circulation Survey (March 1984-May 1985)
Current Meter Locations/with Conductivity and
Temperature sensors
CheMS08 12-14 May 2008
9
Historical Observations
NOS Circulation Survey (March 1984-May 1985)
Current Meter Locations/with Conductivity and
Temperature sensors
CheMS08 12-14 May 2008
10
Historical Observations
NOS Circulation Survey (March 1984-May 1985)
Water Level Gage Locations
CheMS08 12-14 May 2008
11
Historical Observations
NOS Circulation Survey (March 1984-May 1985)
Water Level Gage Locations
CheMS08 12-14 May 2008
12
Establish Bathymetry for the entire region
NOS Soundings
CheMS08 12-14 May 2008
13
Model Initial and Synoptic Conditions
Initial/Lateral Boundary Conditions for
Salinity/Temperature from WOA 2001 Synoptic
Meteorological Conditions from NOAAs 32km
Re-analysis/NOAA Buoys, C-Man stations,
Airports River Discharges/Water Temperatures from
USGS Shelf Lateral Boundary Conditions from
ADCIRC (EC95) Hindcast with Tides/Synoptic
Meteorological Conditions CD Canal NOS
Observations/VDatum ADCIRC Chesapeake/Delaware
Bay Tidal Hindcast
CheMS08 12-14 May 2008
14
Structured Model Grid
CheMS08 12-14 May 2008
15
Structured Model Grid
CheMS08 12-14 May 2008
16
Unstructured Model Grid
CheMS08 12-14 May 2008
17
Skill Assessment
Tidal Dynamics Compute Tidal Constituents at
Water Level and Current Meter Locations Produce
Tidal Constituent Maps/Observed, Model,
Differences for Amplitude and Phase Observed
Times series plots for water levels, currents,
salinity, temperature at depth and differences of
salinity and temperature between depths NOS skill
assessment criteria, including RMSE and Central
Frequency, i.e., 90 within 15 cm for water
level, 26 cm-1sec for currents Compute Skill
Metric for water level, currents, salinity,
temperatures Non-Tidal Events Storm surge and
Freshets Times series plots for water levels
after 30 hour lowpass filter
CheMS08 12-14 May 2008
18
Modeling Strategy
Tidal Simulation Baseline Density
Experiments High River Runoff Hindcast March 21
September 7, 1984
CheMS08 12-14 May 2008
19
Tidal Simulation
CheMS08 12-14 May 2008
20
Tidal Simulation
CheMS08 12-14 May 2008
21
Hindcast
Period March 21 September 7, 1984 Late spring
storm
March 29, 1984
CheMS08 12-14 May 2008
22
Hindcast
Period March 21 September 7, 1984 Three
periods of strong freshets
CheMS08 12-14 May 2008
23
Hindcast Skill
CheMS08 12-14 May 2008
24
Hindcast Skill
CheMS08 12-14 May 2008
25
Hindcast Skill
CheMS08 12-14 May 2008
26
Hindcast Skill
CheMS08 12-14 May 2008
27
Hindcast Skill
CheMS08 12-14 May 2008
28
Hindcast Skill
CheMS08 12-14 May 2008
29
Hindcast Skill
CheMS08 12-14 May 2008
30
Hindcast Skill
CheMS08 12-14 May 2008
31
Hindcast Skill
CheMS08 12-14 May 2008
32
Summary Overview of Delaware Bay MEE
Bathymetry
Grids
Metrics
Model Hindcast
COMMUNITY MODELS
ROMS, POM, ADCIRC, FVCOM, ELCIRC, SELFE, ....
Historical Data
Environmental conditions
Grids, Bathymetry, Environmental conditions
CheMS08 12-14 May 2008
33
Future Directions
Continue DRB individual model enhancements/re-eval
uation Investigate additional model metrics Make
available MEE to other Federal, State, and
Private interested groups via web based system
Look for opportunities for further
collaborations Implementation of MEEs for other
dynamical regimes
CheMS08 12-14 May 2008
34
Acknowledgements
Frank Aikman, Chief of Marine Modeling and
Analysis Programs with CSDL, Lyon Lanerolle,
Edward Myers, Hong Lin, John Kelley, Eugene Wei,
Richard Schmalz, Phil Richardson, Aijun Zhang,
Micah Wengren, Zhizhang Yang, Adeline Wong, and
Tom Gross. I also want to thank Mary Erickson,
the Chief of CSDL and Maureen Kenny, the Deputy
Chief of CSDL for their commitment to this
effort.
CheMS08 12-14 May 2008

