
ISPBENDSARS PowerPoint PPT Presentation
1 / 1
Title: ISPBENDSARS
1
Surreptitious Sensing of Blood Alcohol Content
Remote Near-Infrared Spectroscopic (NIRS) Imaging
and Laser Speech Detection Thaddaeus Hannel,
David J. Link and Robert A. Lodder Department of
Chemistry, University of Kentucky, Lexington, KY
40506
Abstract Alcohol abuse is a major problem in the
United States. The most common measurement tool
used in law enforcements for the determination of
breath alcohol content (BrAC) is the
breathalyzer. However, if surreptitious
measurements of BrAC in free-range humans are
sought then noninvasive and unobtrusive
measurements techniques must be used. In this
work two noninvasive methods for the
determination of BrAC were studied. A validation
study involving five human subjects was done to
assess the supposition that molecular factor
computing (MFC) near-infrared spectroscopic
(NIRS) hyperspectral imaging and laser
interferometry speech detection could be used to
noninvasively detect BrAC. MFC-NIRS imaging
measurements for standard errors of prediction
(SEP) for a global model relative to blood
alcohol was 7.5 mg/dL (0.0075) and r2 0.98.
The laser interferometer measured SEPs for a
global model relative to blood alcohol at 16.0
mg/dL (0.016) and r2 0.82, however individual
SEPs were much lower. Objective To test the
hypothesis that a suite of remote sensing
measurements is able to predict BrAC in drinkers
using multivariate analysis. The sensor should
have the ability to be applied surreptitiously.
Otherwise there is no benefit over existing
methods for studying alcohol in a natural
environment. Introduction A means of measuring
BrAC noninvasively is needed to monitor alcohol
in humans in a natural living environment.
Knowing alcohol level is necessary to evaluate
pharmacotherapy or other therapies. Current
breathalyzer technologies do not collect enough
data at the right times, and wrist measurement
has a compliance problem. Treatments for abusers
of alcohol, including Alcoholics Anonymous (AA)
and other behavior modification-style
organizations, are easy to find. However, the
bulk of the problems are caused by individuals
who are not seeking help. Approximately 39 of
the 400,000 Americans admitted to alcohol
treatment programs are there due to a court order
and not by personal choice1. The need to remain
alcohol-free in order to remain out of the court
system provides an incentive for individuals to
lie about their consumption to counselors and
parole officers. A similar problem arises for
the scientific community studying the effects of
alcohol treatment programs. Evaluating
treatments requires a continuous monitor of
subjects' blood alcohol content (BAC), breath
alcohol content (BrAC, known to be highly
correlated to BAC2) or actual consumption.
Current alcohol content monitoring techniques
include the sampling of breath, urine, saliva or
blood followed by a different analysis to assess
the alcohol level in each. Blood testing is the
most sensitive method, but can suffer from
temporal distortion due to the processing time
needed to obtain the result. Samples can ferment
on their own over time, leading to inaccurate
measures of alcohol consumption. Temporal
distortion is problematic in the research setting
when a time sensitive result is needed. Urine
testing is the most inexpensive of the
techniques, but tests for alcohol in the system
in the past five days, not in real time3.
Techniques that integrate consumption over long
periods of time complicate experiments designed
to test the effects of treatment on acute alcohol
abuse. Contamination, dilution and tampering of
the samples are other common problems in urine
testing 3,4. Breathalyzers are the most common
on-site monitoring technique and are generally
used by law enforcement on the public. The
breathalyzer is the only noninvasive technique
that can be used to monitor real-time alcohol
levels, but it has many drawbacks. Some
breathalyzer devices assume a hematocrit (cell
volume of blood) of approximately 47, where in
reality it ranges from 37 to 52 5. An
individual who has a hematocrit level below the
assumed value will result in a false positive
reading on the breathalyzer 5. Breath testing
can also lead to false positives when blood,
alcohol or vomit is present in an individuals
mouth.
To compensate for changes in contrast and
intensity over the acquisition period, data from
two spherical silicon dioxide reflectance
standards (one high reflectance, and one low
reflectance) were captured in each image. Images
in the video stream were made comparable by
multiplicative scatter correction on the
reflectance standards so that the standards were
identical throughout all images. A reference
standard (Kodak Gray Card) was also used to
correct for temporal and spatial inconsistencies
across the pixels of the detector array. Two
light sources were used during image acquisition
to reduce shadowing and increase the
signal-to-noise ratio of the data. The lights
were placed on each side of the camera at
approximately 45 degrees relative to a line
connecting the subject and camera lens. Images
were attained with each MFC filter with the light
sources turned off and with them on (12 total
spectral images) to correct for ambient lighting
from the room and blackbody radiation from the
subject.
MFC Filter In PCA, a simple transformation will
convert the raw spectra into spectral scores in a
space of reduced dimension. The scaling
constants employed to reconstruct the individual
spectra are commonly called loadings. Ordinary
spectroscopy and PCA chemometrics records signals
with a narrow bandpass at each wavelength and
then weights the signals at each wavelength ?
with a coefficient f in a computer.
loadings f1a?1
f2a?2 f3a?3 However, it is also possible
to weight each wavelength in a spectrum optically
using the absorbance spectra of filter
molecules. The loadings can then simply be
read by an A/D as the voltage from a detector
unit by integrating the total light through the
sample and filter over a broad wavelength band.
In this case, while the loadings are not
perfectly orthogonal, they are often close enough
to permit chemical analyses to be performed.
Table 1. Leave-one-out cross validation
statistics of selected MFC filters. The
advantages to using semi perfect-MFC filters was
realized when PCs where calculated.
Figure 2. Leave-one-out cross validation plot of
A, microphone acquired speech and B, laser
interferometer acquired speech of subject 00005.
Laser Speech Instrumentation The speech
instrumentation was fabricated in house and based
on Michelson interferometry. The interferometer
utilized a battery-powered laser pointer (635 nm)
as the source to simplify aiming. (Production
versions will use an invisible laser wavelength
within the range of the NIR camera to enable
aiming.) The interference fringe pattern was
detected with a phototransistor and amplifier
using a soundcard (M-Audio, Avid Technology Inc)
and was recorded into Cool Edit Pro (Syntrillium
Software Corp.) at a sample rate of 44.1 kHz. A
unidirectional microphone (ECM-330, Sony) that
lacked the resonances of the glass was also used
as a reference standard and placed next to the
reflecting glass. The test subjects were given a
list of 13 words to read that corresponded to
common phonemes of the English language (table,
flat, feet, pet, light, bit, bone, hot, future,
thumb, boot, soil, saw).
Global Versus the Individual Models In actual
deployment, there will probably be individual
calibrations for each person because subjects
will have to enroll in a program to be considered
for monitoring. The calibration process can be
undertaken at enrollment. For this reason, it is
important that we develop individual calibrations
for each participant as well as a global
calibration for all participants. A determination
of how well individual calibrations and a global
calibration perform is necessary using the
success metrics.
Table 3. Leave-one-out cross validation
statistics of selected frequency ranges.
- Potential Product Uses
- Private Industry
- Calibration to individual employees for
continuous monitoring - Preventative measures
- Law enforcement
- Detection of DUI decoys
- Surreptitious detection of intoxicated persons
The laser beam was aimed at a glass target
positioned 2 to 3 feet from each subject. The
sound from subjects' speech induced vibrations in
the glass causing constructive and destructive
interference patterns at the phototransistor,
which were amplified and recorded. The changes
in the interference patterns were stronger at
frequencies where the glass target had
resonances.
Materials are selected for use as molecular
filters by comparing their T spectra to the PC
loadings correlated to the analyte of interest.
PC loadings are highest where spectral
variability is greatest. Low-pass, high-pass, or
broad bandpass filters are used to isolate these
regions of high spectral variability. In
addition, such filters must be used to group
positively and negatively correlated loadings so
the integrated detector response on an MF is not
cancelled. As a result, there may be as many as 2
MFs for each PC in a calibration. Regions that
contain no useful information are blocked by
bandpass filters or multiple molecular compounds.
It is possible to image through molecular filters
to create MFC (PC) images directly. In this study
there were six filters used polyvinyl chloride
(Unbranded, McMaster-Carr), polycarbonate (Lexan,
Plaskolite, Inc.), Acrylic(Unbranded),
polymethyl-methacrylate (Optix, Plaskolite,
Inc.), combined gel filters CC20B and CC40G
(Kodak), and Gel A2 Pale Yellow (Kodak).
Experimental MFC-NIRS Hyperspectral Imaging The
NIR region of the electromagnetic spectrum offers
advantages for use in biological systems as well
as unambiguous identification. NIR radiation is
able to penetrate through the dermal layers of
skin and has been shown to measure accurately
blood levels of analytes in vivo. Thus, diffuse
reflectance NIR imaging is a candidate for
noninvasive determination of blood alcohol.
- Future Work
- Determine if other drugs or impairments can be
correlated to speech - Alcohol detection through windows at a distance
- Conclusions
- NIR hyperspectral imaging and speech are shown to
correlate with BrAC. MFC-NIRS imaging gives a
global correlation much higher than that of the
speech detection method. The global model for
speech determination of BrAC is more difficult to
find though, the results of this study suggest
that individual calibrations of speech can allow
for its use in commercial industries. - References
- 1 Drug and alcohol services information system,
http//www.oas.samhsa.gov/2k5/alcTX/alcTX.htm,
2007 - 2 AW Jones, KM Beylich, A Bjorneboe, J Ingum and
J Morland, Clinical Chemistry 38 743-747,
19923 Rouen, David Dolan, Kate. A Review of
Drug Detection Testing and an Examination of
Urine, Hair, Saliva and Sweat. National Drug and
Alcohol Research Centre. ISBN 0- 7334-1790-6
(2001)4 Katz, N. Fanciullo, GJ. Role of urine
toxicology testing in the management of chronic
opioid therapy. Clin J Pain 2002 1845
Hlastala, Michael. The alcohol breath testa
review. J. of Appl Physiol 1998 84402- 408 - Acknowledgement
- This work was supported in part by the NIAAA,
NIH, DARPA and KSEF (Grant KSEF-914-RDE-008).
Due to temporal differences in subject speech,
the time domain data was Fourier transformed (FT)
into a frequency domain. Regions of the time
domain data that did not contain speech were
removed so that the FT was a combination of all
frequencies. Due to the large volume of data PCs
were calculated over frequency intervals where
speech was expected to be found. It was found
that different subjects required different
frequency intervals. This may be attributed to
the differences in individual vocal clarity and
ability.
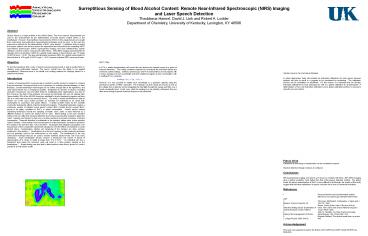
Figure 1. Principal component analysis was
performed on each MFC data set A. MFC
hyperspectral imaging leave-one-out cross
validation plot of subject 00006 using only
polymethyl-methacrylate (Filter 6) MFC filter.
B. Leave-one-out cross validation plot of pooled
image data (n 5) using combined MFC filter data
of Gel A2 Pale Yellow (Filter 5) and filter 6.
Ethanol shown in purple
In theory, if the MFC filters had been perfectly
weighted functions of the ethanol in solution PCs
would not need to be calculated. The intensity
signals at each pixel of the images would be PC
scores and these should correlate to BrAC. In
this case there were six MFC filters which would
produce six PC scores. Calculation of the PCs
from the MFC filters required sampling several
pixels at different facial regions. The pixels
were averaged together for each image and used as
the PC score for the corresponding filter. This
produced one data point per image, or sample, per
filter. In the end there were six PC scores for
all samples. However this analysis did not
produce highly correlated results mainly due to
the imperfect nature of the filters (solid
material with a perfect analyte loading
response was not available).
An IRC-160 InSb focal plane array video camera
(Cincinnati Electronics, Mason, OH) with
Molecular Factor Component (MFC) filters was used
for imaging of the subjects. The camera
integration time was 12.96 ms and the photon
energy response was 1800-10,000 cm-1. A rotating
disk was made in house to allow the different MFC
filters to be rotated in front of the camera
lens.
Table 2. Frequency ranges used in cross
validation analysis.
Recommended
