
Global Temperatures PowerPoint PPT Presentation
1 / 55
Title: Global Temperatures
1
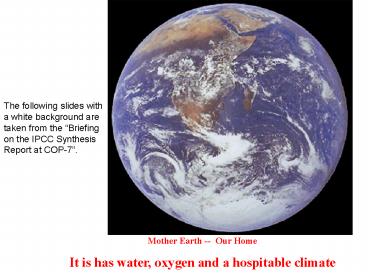
The following slides with a white background are
taken from the Briefing on the IPCC Synthesis
Report at COP-7.
Mother Earth -- Our Home It is has water, oxygen
and a hospitable climate
2
Effect of increasing temperatures greenhouse
warming Recall the greenhouse effect is the
warming of air temperatures in the troposphere
due to certain natural and anthropogenic
pollutants in the atmosphere, which delay the
loss of heat to space and keep bouncing it back
to Earth's surface When these short term effects
persist for decades (as they have since the
1970s), we begin to see disruptions of climate
patterns
3
- Global Warming
- Evidence that temperatures are warming around the
Earth - 7 of 10 warmest years on record have occurred
since 1990 - 1990's was warmest decade on record
- 1980's was second warmest decade on record
- mean temperature of Earth increased 1?F during
20th century - 20th century had warmest temperatures of the
millenium
4
Global Temperatures
Figure 10.28
5
- Facts concerning greenhouse warming
- Temperatures have been rising since 1970
- The snowline in portions of the Alps has
retreated up the mountains by 100m (330ft) in
elevation - 43 of the Arctic Ocean ice pack has
disappeared - We still don't understand what the total effect
is on glaciers, coastal ice shelves around
Antarctica, rising sea level, more intense
weather systems and storms, changes in vegetation
and marine life
6
- Evidence from temperature-dependent phenomena
- mountain glaciers are melting
- Antarctic ice sheets are breaking up
- sea level is rising
- average temperature of global ocean is rising
- permafrost in N hemisphere is melting
- Arctic pack ice is thinning and retreating
7
Mountain glaciers are melting Average elevation
of glaciers in mountains of New Zealand moved up
300 ft during 20th century Half of all glacial
ice in mountains of Russia melted since
1960 Glacial retreat in mountains of Peru has
increased 7X between 1987 and 1995 Glaciers in
Glacier National Park melting rapidly (go now
if you want to see them - when they are gone
that's it folks they wont form again during
our lifetime)
8
Antarctic ice sheets are breaking up
Edge of West Antarctic ice sheet shrinking at
rate of 400 ft/year Breaking of ice sheet into
icebergs does not by itself raise sea level
because the ice shelves are already floating ice
It does not displace any more water when it
breaks off
9
But loss of the ice sheet may affect how fast the
glaciers on the continent move and melt It is
the melting of the ice that raises sea level
If the West Antarctic ice sheet melts, it will
cause global sea level to rise by 6 meters If
both the West Antarctic ice sheet and the Ross
Ice sheet melt, it would cause sea level to rise
70 meters Arctic pack ice is thinning and
retreating
The floating pack in Arctic has lost 40 volume
since 1958
10
Sea level is rising Sea level has risen 10-25 cm
during 20th century simply because of rising sea
surface temperatures alone (warmer water
expands and takes up more space rising sea
level) If sea level rises by 1/2 meter, it will
cause flooding of 5000 square miles of currently
dry land and another 4000 square miles of
present-day wetlands
11
Sea Levels have risen
12
Average temperature of global ocean is
rising Between 1955 and 1995, world ocean warmed
by average of 1?F down to surface of 3000
meters Indian Ocean warmed 0.5?F down to depth of
800 meters over 20 years. The warming of ocean at
deeper depths represents heat being stored in
ocean that would normally be in the atmosphere
This is temporarily slowing the warming of the
atmosphere, but as it is released to the
atmosphere over time it will cause global air
temperatures to rise another 1?F over next
century This is in addition to the warming
being caused by greenhouse effect!
13
The Land and Oceans have warmed
14
Global mean surface temperatures have increased
15
Observed regional changes in temperature have
been associated with observed changes in physical
and biological systems
- Examples include
- non-polar glacier retreat
- reduction in Arctic sea ice extent and thickness
in summer - earlier flowering and longer growing and breeding
season for plants and animals in the N.H. - poleward and upward (altitudinal) migration of
plants, birds, fish and insects earlier spring
migration and later departure of birds in the
N.H. - increased incidence of coral bleaching
16
Permafrost in N hemisphere is melting In Alaska,
in areas marking the boundary between permafrost
and soil (no permafrost), temperatures are close
to the freeze-thaw boundary so any small rise in
temperature results in large areas of permafrost
melting Along this boundary permafrost is
currently melting downward at rate of 3 ft/10
years In China, areas of permafrost are melting
(boundary is moving northward) at rate of 1
mile/year Around Mt McKinley, areas that used to
be arctic meadows on permafrost are now areas of
dry meadows containing open water ponds Most of
melting occurred since 1980 20-25 of Earth's
land surface contains permafrost
17
Precipitation patterns have changed
18
The frequency, persistence and magnitude of
El-Nino events have increased in the last 20 years
The El-Nino phenomena leads to floods and
droughts throughout the tropics and subtropics
19
Reasons for global warming Greenhouse
gases CO2 CH4 20X more effective than
CO2 (methane) CFC's 10,000X more effective
(chlorofluorocarbons) O3 20X more
effective (ozone)
20
Carbon Dioxide Sources
Figure 10.29
CO2 works as greenhouse gas because it lets in
the solar radiation, but traps the reradiated
infrared radiation coming from Earth Does not
let that energy escape to space Causes Earth's
atmosphere to warm
21
Sources of additional CO2 in atmosphere Burning
of fossil fuels (coal, oil, gasoline), burning of
natural vegetation when clearing land for
agriculture (which is still going on in many 3rd
world nations) Over last century, fossil fuel
burning cement manufacturing released 200
billion tons of carbon to atmosphere US is by far
the greatest contributor of CO2 to
atmosphere Deforestation (by burning
vegetation) Directly releases CO2 to atmosphere,
and reduces ability of plants to take up CO2
during photosynthesis (by removing the plants)
22
Amount of CO2 in atmosphere is controlled by 2
things Rate of CO2 addition and rate of CO2
removal (by plants and the ocean) About 40 of
CO2 added to atmosphere is removed again by
absorption by biomass (plants) or the ocean The
rest accumulates in the atmosphere Amount of CO2
moved into or out of the atmosphere by non-human
processes between vegetation and the ocean is
much larger than the CO2 moved by humans
remember the ocean dissolves CO2 and is a large
factor controlling amount of CO2 in atmosphere of
different planets
23
Of the 315 billion tons CO2 put in atmosphere
since 1850, only 130 billion tons remains today,
but about half the CO2 added to atmosphere by
humans between 1981 and 1990 is still
there. Where has the rest of that CO2 gone and
what is the process removing it? We still don't
know the answers.
24
Human activities have changed the composition of
the atmosphere since the pre- industrial era
25
Methane (CH4) Forms a positive feedback If
CH4 added to atmosphere it causes warming which
causes more CH4 to be released This increase
lately is from increased livestock raising
(cows), rice cultivation, industry, mining, and
landfills. Also permafrost plays a role The
frozen ground is a barrier to the gases trapped
below that layer, preventing it from getting into
atmosphere But if permafrost melts then these
gases including CH4 are free to escape to the
atmosphere
26
Methane concentrations in air bubbles trapped in
ice cores 100,000 years ago CH4 in atmosphere
was 500 ppb (parts per billion) By 70,000 years
ago, CH4 was 650 ppb
By 20,000 years ago at height of glacial maximum
CH4 dropped to 350 ppb (why?) After warming
during interglacial, CH4 went back up to 650 ppb
again and was constant until 1800 In past 200
years CH4 levels have risen 250 and by late
1800's was up to 800 ppb and by 1995 was 1600 ppb
(with sharp increase since 1960)
27
CFC's Even though are present at very low levels
in atmosphere, are responsible for about 25 of
geenhouse forcing because they are so much more
powerful at absorbing infrared radiation than any
other chemical In addition CFC's create ozone in
the troposphere that shouldn't be there (remember
the natural ozone layer is high in the
stratosphere)
28
Ozone Has been increasing in troposphere below
10 km altitude at rate of 1/year At this
altitude it does not absorb harmful UV radiation
but instead traps infrared radiation Ozone in
troposphere also formed by presence of nitrous
oxides in atmosphere from airplane exhaust Ozone
is not a major player in greenhouse warming, but
is a more powerful greenhouse gas than CO2
29
(No Transcript)
30
Uncertainty over the future What does all this
mean? Conflicting processes Example Sulfur
dioxide (SO2) - comes from burning of fossil
fuels Are very small nuclei for cloud formation
Clouds made of small raindrops reflect more
radiation than clouds made of large raindrops
(higher albedo) Which results in a cooling of
the atmosphere Both SO2 and CO2 come from burning
of fossil fuels - but one causes global warming
and the other causes cooling Which one is
bigger?
31
Global mean surface temperature is projected to
increase during the 21st century
32
Variable warming If average global temperatures
rise, areas near poles will warm 2-3X more than
equatorial regions
33
Land areas are projected to warm more than the
oceans with the greatest warming at high latitudes
Annual mean temperature change, 2071 to 2100
relative to 1990 Global Average in 2085 3.1oC
34
Some areas are projected to become wetter, others
drier with an overall increase projected
Annual mean precipitation change 2071 to 2100
Relative to 1990
35
Mean sea level is projected to rise by 0.09 to
0.88m by 2100, but with significant regional
variations
36
What would be the result of global sea surface
temperatures rising? Not certain whether rising
sea surface temperatures would result in more
melting of polar ice caps or growth of ice
caps If water warms slightly but not enough to
raise air temperatures over ice to above
freezing, then it may result in greater
snowfall (more evaporation from oceans but
still low temperatures over poles
precipitation as snow and formation of ice)
Which would lower sea level
37
Initially increased agricultural productivity in
some mid-latitude regions reduction in the
tropics and sub-tropics even with warming of a
few degrees
2020s 2050s 2080s
38
coral bleaching events are expected to increase
Branching coral
Brain coral
39
Increased risk of floods, potentially displacing
tens of millions of people, due to sea level rise
and heavy rainfall events, especially in Small
Island States and low-lying deltaic areas.
Bangladesh is projected to lose about 17 of its
land area with a sea level rise of one meter -
very difficult to adapt due to lack of adaptive
capacity
projected
present
40
Uncertainties where is that missing CO2 from
atmosphere going? will changes in cloud cover in
the future result in more albedo (cooling) or
more greenhouse warming? what is the role of the
ocean in controlling temperature and CO2
levels? We only know part of the picture right
now. will humans place restrictions on their
emissions of greenhouse gases? Even if we do,
it will take several centuries for those chemical
changes to start affecting temperatures in the
atmosphere
41
Developing countries are the most vulnerable to
climate change
- Impacts are worse - already more flood and
drought prone and a large share of the economy is
in climate sensitive sectors - Lower capacity to adapt because of a lack of
financial, institutional and technological
capacity and access to knowledge - Climate change is likely to impact
disproportionately upon the poorest countries and
the poorest persons within countries,
exacerbating inequities in health status and
access to adequate food, clean water and other
resources. - Net market sector effects are expected to be
negative in most developing countries
42
World Population 6,056,528,577
The Challenge Sustainable Management of an
Ever-Changing Planet
43
The Challenge Sustainable Energy
44
The Challenge Food Security
45
- Food production needs to double to meet the needs
of an additional 3 billion people in the next 30
years
Climate change is projected to decrease
agricultural productivity in the tropics and
sub-tropics for almost any amount of warming
46
The Challenge Sustainable Forestry
47
- Wood fuel is the only source of fuel for one
third of the worlds population
Wood demand will double in next 50 years
Climate change is projected to increase forest
productivity, but forest management will become
more difficult, due to an increase in pests and
fires
48
The Challenge Water Security
49
Water Services
Climate change is projected to decrease water
availability in many arid- and semi-arid regions
Population facing water scarcity will more than
double over the next 30 years
- One third of the worlds population is now
subject to water scarcity
50
The Challenge Sustainable Fisheries
51
The Challenge Sustainable use conservation of
biodiversity
52
Estimated 10-15 of the worlds species could
become extinct over the next 30 years
- Biodiversity underlies all ecological goods and
services
Climate change will exacerbate the loss of
biodiversity
53
A note about philosophy The Earth is now at the
same temperature as the warmest period it has had
in the last 125,000 years Always before, climate
was determined by "natural processes" But now
the population of humans and our
industrial/economic processes are adding a new
variable to the equation Some people say that it
is not a natural process - but humans are natural
- yes? At what point does the effect of humans
move from "natural" to "artificial"? by becoming
so dependent on industry (that is not natural)...
54
Cost of new energy technologies have declined
steeply, but costs of conventional technologies
have also declined at a slower rate
10
1
Production costs (EURO1990/kWh)
0.1
0.01
100
10000
1000000
Cumulative Installed Capacity (MW)
Electric technologies, EU 1980-1995, Source IEA
55
What can we do as individuals? Be aware of how
our actions affect the climate how much
gasoline do you burn by driving cars? how
efficient is your car (miles per gallon)? how
much electricity do you use? how much of it is
wasted? how much of the things you buy are
processed? could you replace any of that with
less processed items? how much packaging is used
in the things you buy? in the grocery,
online? Be active in local, regional, national
politics - write to your congressmen/representativ
es/ the President about matters that concern you
- it doesn't take long to write a form letter and
send it to as many politicians as you want.
Recommended
