
Monitor Switch PowerPoint PPT Presentation
1 / 12
Title: Monitor Switch
1
Monitor - Switch
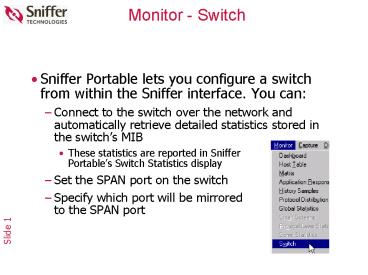
- Sniffer Portable lets you configure a switch from
within the Sniffer interface. You can - Connect to the switch over the network and
automatically retrieve detailed statistics stored
in the switchs MIB - These statistics are reported in
SnifferPortables Switch Statistics display - Set the SPAN port on the switch
- Specify which port will be mirroredto the SPAN
port
2
Span Port
3
Monitor - Switch (cont.)
- Start a capture on the specified port or VLAN and
see switch-specific Expert analysis - Set thresholds on the switch for different alarms
based on RMON statistics in the Statistics and
Interface groups - These alarms are reported back to Sniffer
Portable from the switch and are recorded in the
Alarm Log - Set triggers so that Sniffer Portable can
automatically set SPAN and start capture on a
switch port for which an alarm is reported
4
Monitor Tips
- Monitor runs in the background the entire time
that Sniffer Portable is active - There are no stop and start commands
- The individual applications accumulate data only
when they are open - If you close them down then open them, they start
the counts at zero - To keep running statistics, open the applications
you need, then cascade or minimize them - Use Database to save them to a CSV file
5
Establish a Baseline
- Statistical characterization of your critical
segments - Understand and predict growth patterns
- Intelligently plan for hardware and software
implementation - Basis for comparison when problems occur
- Response time measurements of regular events
- Quantify the users view of the network in real
numbers - Track performance levels for frequently used
tasks and protocols - Compare history with current events when response
time degrades - Topology diagrams updated regularly
- Maintain visual control of your physical network
- Use as a visual reference when considering
changes - A basis for continuity when personnel come and go
- Decrease wasted time if consulting services are
necessary
6
Baselining Procedures
- 1. Implement a regular schedule for baselining
that includes high, medium and low periods of
network utilization. - 2. Monitor for a standard period of time (10
minutes for example) and record statistical
measurements. - 3. Capture and filter on a particular network
station. - 4. Execute a predetermined set of procedures and
commands that will provide the necessary
command/response combinations. Document those
response times. - 5. Record conclusions taken from expert systems.
- 6. Update segment diagrams.
- 7. Capture for a reasonable period of time and
save the data file as part of your baseline
documentation.
Statistics Total Stations Max. Inserted
Stations Average Usage Total Frames Total
Bytes Average Frame Size Ring Purges Error
Reports 1 Station Usage 2 Station
Usage 3 Station Usage Source Routed
Frames Remote Rings Protocol 1 Protocol 2
Protocol 3 Transmit Timer Avg Response
Times NetWare Create File Cmd/Resp NetWare File
Read Cmd/Resp NFS Create File Cmd/Resp TCP
Session Establishment Telnet Cmd/Echo/Ack
7
Troubleshoot from the Bottom Up
7. Are applications working efficiently and
operations succeeding?
6. Is encoding, encryption OK?
5. Are remote procedure calls functioning?
4. Are ACKs flow control working?
3. Is routing or frame delivery OK?
2. Are connections working correctly?
1. Are there physical problems?
Many times problems at the higher layers will go
away when the lower layer problems are solved!
8
Expert Analyzer vs. OSI
Service
OSI Application Layer Info
OSI Application Layer Info
Application
OSI Session Layer Info
Session
Connection
OSI Transport Layer Info
Station
OSI Network Layer Info
OSI MAC Layer Info
DLC
Global Statistics
Segment Performance
Route
RIP Routing Information
Subnet
Subnet Pairs Seen
9
Expert Analyzer Layers
Examines application protocol sessions with
individual servers and their overload status.
Service
Examines the session establishment and
communications between two application processes.
Application
Manages the conversation between two
communicatingapplications.
Session
Checks for problems related to the efficiency of
end-to-end communications and error recovery.
Connection
- Checks for network addressing and routing
problems. - Also interprets traffic between subnetworks and
measures the distance between subnetworks in hops.
Station
Tracks the actual transfer of data, identifying
line/burst errors, ring beaconing, and physical
error frames.
DLC
Deals with symptoms which do not reside at any
particular layer. Examples Broadcast Storms, LAN
Overload, WAN underload, etc.
Global
Stores routing information from TCP/IP RIP frames
it has observed. Symptoms and diagnoses alert you
to changes in routing tables.
Route
Provides information on all communicating
subnetworks.
Subnet
10
Capturing in a Bridged Environment
- If Node A is communicating with Node D, the frame
content does not change when it crosses the bridge
Network 200
Network 200
Transparent Bridging
Node A DEFG
Sniffer
Node C ZYX3
Bridge
Node B AB91
Node D PQRS
Dest MAC
Source MAC
PQRS DEFG 0800 200.28.38.40
200.28.38.38 .... Data
PQRS DEFG 0800 200.28.38.40 200.28.38.38
.....Data
11
Capturing in a Routed Environment
- If Node A is communicating with Node D, the DLC
addresses will change when the frame crosses the
router
Network 200
Network 201
Sniffer
Active Device
Node A DEFG
Node C ZYX3
Default gateway
Router
Node B AB91
XYZ 3
Node D PQRS
Dest MAC
Source MAC
ABC3 DEFG 0800 200.28.38.40 201.28.38.38
.... Data
PQRS XYZ3 0800 200.28.38.40
201.28.38.38 ..... Data
12
Capturing in a Switched Environment
- If Node A is communicating with Node D, the frame
content does not change when it crosses the switch
Sniffer
Node D
Broadcast Traffic plus...
Node A
Switch
Node E
Node B
Node C
Node F
Recommended
