
Free Energy and Electropotential PowerPoint PPT Presentation
1 / 33
Title: Free Energy and Electropotential
1
Free Energy and Electropotential
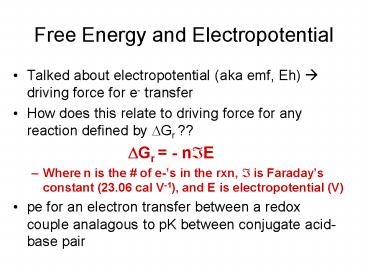
- Talked about electropotential (aka emf, Eh) ?
driving force for e- transfer - How does this relate to driving force for any
reaction defined by DGr ?? - DGr - n?E
- Where n is the of e-s in the rxn, ? is
Faradays constant (23.06 cal V-1), and E is
electropotential (V) - pe for an electron transfer between a redox
couple analagous to pK between conjugate
acid-base pair
2
Electromotive Series
- When we put two redox species together, they will
react towards equilibrium, i.e., e- will move ?
which ones move electrons from others better is
the electromotive series - Measurement of this is through the
electropotential for half-reactions of any redox
couple (like Fe2 and Fe3) - Because DG0r -n?DE, combining two half
reactions in a certain way will yield either a
or electropotential (additive, remember to
switch sign when reversing a rxn) - -E ? - DGr, therefore ? spontaneous
- In order of decreasing strength as a reducing
agent ? strong reducing agents are better e-
donors
3
(No Transcript)
4
Nernst Equation
- Consider the half reaction
- NO3- 10H 8e- ? NH4 3H2O(l)
- We can calculate the Eh if the activities of H,
NO3-, and NH4 are known. The general Nernst
equation is - The Nernst equation for this reaction at 25C is
5
- Lets assume that the concentrations of NO3- and
NH4 have been measured to be 10-5 M and 3?10-7
M, respectively, and pH 5. What are the Eh and
pe of this water? - First, we must make use of the relationship
- For the reaction of interest
- ?rG 3(-237.1) (-79.4) - (-110.8)
- -679.9 kJ mol-1
6
- The Nernst equation now becomes
- substituting the known concentrations (neglecting
activity coefficients) - and
7
Eh Measurement and meaning
- Eh is the driving force for a redox reaction
- No exposed live wires in natural systems
(usually) ? where does Eh come from? - From Nernst ? redox couples exist at some Eh
(Fe2/Fe31, Eh 0.77V) - When two redox species (like Fe2 and O2) come
together, they should react towards equilibrium - Total Eh of a solution is measure of that
equilibrium
8
FIELD APPARATUS FOR Eh MEASUREMENTS
9
CALIBRATION OF ELECTRODES
- The indicator electrode is usually platinum.
- In practice, the SHE is not a convenient field
reference electrode. - More convenient reference electrodes include
saturated calomel (SCE - mercury in mercurous
chloride solution) or silver-silver chloride
electrodes. - A standard solution is employed to calibrate the
electrode. - Zobells solution - solution of potassium
ferric-ferro cyanide of known Eh.
10
CONVERTING ELECTRODE READING TO Eh
- Once a stable potential has been obtained, the
reading can be converted to Eh using the equation - Ehsys Eobs EhZobell - EhZobell-observed
- Ehsys the Eh of the water sample.
- Eobs the measured potential of the water sample
relative to the reference electrode. - EhZobell the theoretical Eh of the Zobell
solution - EhZobell 0.428 - 0.0022 (t - 25)
- EhZobell-observed the measured potential of the
Zobell solution relative to the reference
electrode.
11
PROBLEMS WITH Eh MEASUREMENTS
- Natural waters contain many redox couples NOT at
equilibrium it is not always clear to which
couple (if any) the Eh electrode is responding. - Eh values calculated from redox couples often do
not correlate with each other or directly
measured Eh values. - Eh can change during sampling and measurement if
caution is not exercised. - Electrode material (Pt usually used, others also
used) - Many species are not electroactive (do NOT react
electrode) - Many species of O, N, C, As, Se, and S are not
electroactive at Pt - electrode can become poisoned by sulfide, etc.
12
Figure 5-6 from Kehew (2001). Plot of Eh values
computed from the Nernst equation vs.
field-measured Eh values.
13
Other methods of determining the redox state of
natural systems
- For some, we can directly measure the redox
couple (such as Fe2 and Fe3) - Techniques to directly measure redox SPECIES
- Amperometry (ion specific electrodes)
- Voltammetry
- Chromatography
- Spectrophotometry/ colorimetry
- EPR, NMR
- Synchrotron based XANES, EXAFS, etc.
14
REDOX CLASSIFICATION OF NATURAL WATERS
- Oxic waters - waters that contain measurable
dissolved oxygen. - Suboxic waters - waters that lack measurable
oxygen or sulfide, but do contain significant
dissolved iron (gt 0.1 mg L-1). - Reducing waters (anoxic) - waters that contain
both dissolved iron and sulfide.
15
The Redox ladder
O2
Oxic
H2O
NO3-
N2
MnO2
Post - oxic
Mn2
Fe(OH)3
Fe2
SO42-
Sulfidic
H2S
CO2
CH4
H2O
Methanic
H2
The redox-couples are shown on each stair-step,
where the most energy is gained at the top step
and the least at the bottom step. (Gibbs free
energy becomes more positive going down the
steps)
16
Redox titrations
- Imagine an oxic water being reduced to become an
anoxic water - We can change the Eh of a solution by adding
reductant or oxidant just like we can change pH
by adding an acid or base - Just as pK determined which conjugate acid-base
pair would buffer pH, pe determines what redox
pair will buffer Eh (and thus be reduced/oxidized
themselves)
17
Redox titration II
- Lets modify a bjerrum plot to reflect pe changes
18
Redox titrations in complex solutions
- For redox couples not directly related, there is
a ladder of changing activity - Couple with highest potential reduced first,
oxidized last - Thermodynamics drives this!!
19
Stability Limits of Water
- H2O ? 2 H ½ O2(g) 2e-
- Using the Nernst Equation
- Must assign 1 value to plot in x-y space (PO2)
- Then define a line in pH Eh space
20
UPPER STABILITY LIMIT OF WATER (Eh-pH)
- To determine the upper limit on an Eh-pH diagram,
we start with the same reaction - 1/2O2(g) 2e- 2H ? H2O
- but now we employ the Nernst eq.
21
- As for the pe-pH diagram, we assume that pO2 1
atm. This results in - This yields a line with slope of -0.0592.
22
LOWER STABILITY LIMIT OF WATER (Eh-pH)
- Starting with
- H e- ? 1/2H2(g)
- we write the Nernst equation
- We set pH2 1 atm. Also, ?Gr 0, so E0 0.
Thus, we have
23
(No Transcript)
24
(No Transcript)
25
Redox titrations
- Imagine an oxic water being reduced to become an
anoxic water - We can change the Eh of a solution by adding
reductant or oxidant just like we can change pH
by adding an acid or base - Just as pK determined which conjugate acid-base
pair would buffer pH, pe determines what redox
pair will buffer Eh (and thus be reduced/oxidized
themselves)
26
Making stability diagrams
- For any reaction we wish to consider, we can
write a mass action equation for that reaction - We make 2-axis diagrams to represent how several
reactions change with respect to 2 variables (the
axes) - Common examples Eh-pH, PO2-pH, T-x, x-y,
x/y-z, etc
27
Construction of these diagrams
- For selected reactions
- Fe2 2 H2O ? FeOOH e- 3 H
- How would we describe this reaction on a 2-D
diagram? What would we need to define or assume?
28
- How about
- Fe3 2 H2O ? FeOOH(ferrihydrite) 3 H
- KspH3/Fe3
- log K3 pH logFe3
- How would one put this on an Eh-pH diagram, could
it go into any other type of diagram (what other
factors affect this equilibrium description???)
29
Brief respite from redox
- To determine whether or not a water is saturated
with an aluminosilicate such as K-feldspar, we
could write a dissolution reaction such as - KAlSi3O8 4H 4H2O ? K Al3 3H4SiO40
- We could then determine the equilibrium constant
- from Gibbs free energies of formation. The IAP
could then be determined from a water analysis,
and the saturation index calculated.
30
INCONGRUENT DISSOLUTION
- Aluminosilicate minerals usually dissolve
incongruently, e.g., - 2KAlSi3O8 2H 9H2O
- ? Al2Si2O5(OH)4 2K 4H4SiO40
- As a result of these factors, relations among
solutions and aluminosilicate minerals are often
depicted graphically on a type of mineral
stability diagram called an activity diagram.
31
ACTIVITY DIAGRAMS THE K2O-Al2O3-SiO2-H2O SYSTEM
- We will now calculate an activity diagram for the
following phases gibbsite Al(OH)3, kaolinite
Al2Si2O5(OH)4, pyrophyllite Al2Si4O10(OH)2,
muscovite KAl3Si3O10(OH)2, and K-feldspar
KAlSi3O8. - The axes will be a K/a H vs. a H4SiO40.
- The diagram is divided up into fields where only
one of the above phases is stable, separated by
straight line boundaries.
32
Activity diagram showing the stability
relationships among some minerals in the system
K2O-Al2O3-SiO2-H2O at 25C. The dashed lines
represent saturation with respect to quartz and
amorphous silica.
33
Seeing this, what are the reactions these lines
represent?
Recommended
