
HUDSON RIVER, NY PowerPoint PPT Presentation
1 / 39
Title: HUDSON RIVER, NY
1
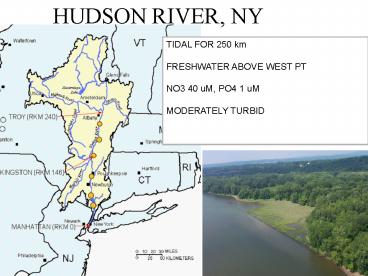
HUDSON RIVER, NY
TIDAL FOR 250 km FRESHWATER ABOVE WEST PT NO3
40 uM, PO4 1 uM MODERATELY TURBID
2
HUDSON TIDAL FW WETLANDS(Factoids)
- Approx. 200 average size 57 acres (23 ha)
- Const. Marsh 500 Iona 300 acres
- Total area 4500 ha (11,250 acres)
- 15 of river area, evenly distributed
- 2.5 of river volume exchanged/day
- In summer water residence time is gt100 days, a
molecule of HR water is likely to have been in a
wetland.
3
17,000,000 m3/day (summer flow)
1,000,000 m3/day (tidal exchange)
4
FRESHWATER WETLANDS ACT
- 6. Multiple benefits
- a. Flood and storm control
- b. Wildlife habitat
- c. Protection of subsurface water
- d. Recreation
- e. Pollution treatment
- f. Erosion control
- g. Education and research
- h. Open space
- I. Sources of nutrients
5
(No Transcript)
6
ZONATION
7
ZONATION / ELEVATION
Broadleaf
Emergent
Hummocks
Submerged
8
(No Transcript)
9
PRODUCTION COMPARISON
- River wide annual carbon supply
- Marsh plants 10,000 mT (1 mT 1000 kg C)
- Phytoplankton 3400 mT
- Submersed 360 mT (revising upwards)
- From watershed 186,000 mT
10
Detritus plant litter
11
Detritus Decomposition
DEAD PLANTS
DOC
Fungi
CO2 CH4
Bacteria
Fine POM
N,P etc
External Nutrients
12
MASS LOSS
TIME TO ½ MASS Fast submersed
(days-weeks) Medium emergent (months
year) Slow wood (year decade)
100
ORIGINAL MASS
TIME
13
Organisms
All pictures taken from http//www.chebucto.ns.ca/
Science/SWCS/ZOOBENTH/
14
FISHES
15
TIDAL WETLANDS AND ECOSYSTEM FUNCTIONING
Process Studies Measure rates of material
movement, transformation at sites within system.
Use book-keeping to understand whole
system. Whole-system budgets Measure inputs
and outputs, infer transformations and processes.
16
EXCHANGE WITH MAINSTEM
17
(No Transcript)
18
NET EXCHANGE OF SUSPENDED MATTER(Tivoli S Bay,
A. Goldhammer)
IN
OUT
Wetland is net sink for particulate
matter (water clarity, sedimentation)
19
These wetlands are sinks for nitrate
20
Variable NO3 Removal Across Sites
Slope of ebb-tide decline as measure of removal
8 of 9 sites had negative slopes No ability to
account for magnitude
21
DENITRIFICATION
NO3
N2O
N2
Greenhouse Gas
Return to Atmosphere
Mobile form of Nitrogen
- OPTIMUM CONDITIONS
- Absence of oxygen
- Available organic matter
- Supply of nitrate
22
NITROGEN BUDGET (Tivoli N Bay)(kg N/ha/yr)
Atmospheric Deposition
Stream
240
10
Tidal Exchange
23-74
Plants 20-60
165 (net input)
Denitrification
Burial
47
23
EXCHANGE WITH MAINSTEM
24
www.hrecos.org
25
(No Transcript)
26
(No Transcript)
27
Phragmites australisCommon Reed
Native to NE USA Rapidly expanding range Higher
biomass than extant vegetation Reed 2-4 kg
DM/m2 Cattail 1-2
28
STRAWMAN Phragmites is Poor wildlife
habitat Low plant community richness Low
detritus quality
29
MEASURES OF DETRITUS QUALITY
- Decay rate
- Fast implies high quality
- Slow may allow burial
- Ability to support microbial growth
- Microbes immobilize nutrients
- Microbes associated with food quality
30
FUNGAL BIOMASS
31
Phragmites TAKE HOME
COMPARED TO WHAT?
WalMart
Wonderland
BIOMASS
32
How Much Detail is Needed to Understand
Whole-System Effects on Water Quality?
33
(No Transcript)
34
OFTEN USEFUL TO SEPARATE COMPONENTS
ECOSYSTEMS AS BLACK BOXES
Understanding variation in time/space Controlled
by different factors Regulatory management
35
FIELD EXERCISE THURSDAYMeasure water quality at
sub-units
36
ON SITE
- Record Site/Time
- Measure stage
- Record Dissolved Oxygen
- Collect water sample
37
SAFETY
- WATER, SUNSCREEN, PFD, RADIO/PHONE
38
www.hrecos.org
39
(No Transcript)
Recommended
