
Diapositiva 1 - PowerPoint PPT Presentation
1 / 104
Title: Diapositiva 1
1
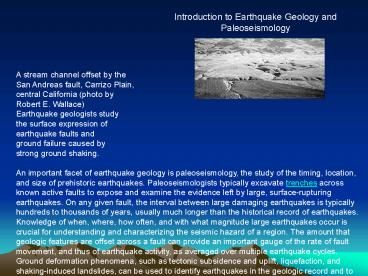
Introduction to Earthquake Geology and
Paleoseismology
2
Integration of plate motion, seismological,
geodetic other geophysical and geological
data, with lab results modeling, gives insight
into lithospheric process Lots remains to be
done Many basic issues unresolved
3
The San Francisco earthquake and fire of April
18, 1906, took about 700 lives and caused
millions of dollars worth of damage in California
from Eureka southward to Salinas and beyond. The
earthquake was felt as far away as Oregon and
central Nevada. The 1906 earthquake, which has
been estimated at a magnitude 8.3 on the Richter
Scale, caused intensities as high as XI on the
Modified Mercalli Scale. Surface offsets occurred
along a 250- mile length of the fault from San
Juan Bautista north past Point Arena and offshore
to Cape Mendocino.
A fence, near Point Reyes,
California, offset 8.5 feet by displacement on
the fault during the 1906 earthquake (photo by
G.K. Gilbert)
4
When Could the Next Large Earthquake Occur Along
the San Andreas Fault? Along the Earth's plate
boundaries, such as the San Andreas fault,
segments exist where no large earthquakes have
occurred for long intervals of time. Scientists
term these segments "seismic gaps" and, in
general, have been successful in forecasting the
time when some of the seismic gaps will produce
large earthquakes. Geologic studies show that
over the past 1,400 to 1,500 years large
earthquakes have occurred at about 150-year
intervals on the southern San Andreas fault. As
the last large earthquake on the southern San
Andreas occurred in 1857, that section of the
fault is considered a likely location for an
earthquake within the next few decades. The San
Francisco Bay area has a slightly lower potential
for a great earthquake, as less than 100 years
have passed since the great 1906 earthquake
however, moderate-sized, potentially damaging
earthquakes could occur in this area at any
time.
A devastating fire
followed the 1906 earthquake in San Francisco
(photo from the P.E. Hotz Collection, USGS
Library, Menlo Park, California)
5
Of course surface rupture tells only part of the
story, but for past earthquakes, this is usually
what we have to work with. Although individual
surface ruptures may not keep pace with the
overall slip of the fault, over time, the slip
rate will equal the overall rate.
6
- Paleoseismic lines of evidence
- Sand blows
- Fault offset/colluvial wedges
- Damaged/killed trees
- Precarious rocks
- Turbidites/landslides
- Coseismic uplift/subsidence
- Tsunami deposits
7
The photographs below are from a sand blow near
Marianna, Arkansas, believed to be the largest
such feature documented at this distance (100
km) from the New Madrid Seismic Zone.
8
Dendrochronology Knowledge of the seismicity for
a region is one of the keys to estimating
earthquake hazards. Unfortunately, historical
records are generally inadequate for evaluations
of seismicity. Paleoseismology addresses this
problem using various techniques for dating
earthquake-disturbed materials prior to the time
of recorded information. Trees, with identifiable
annual growth increments, widespread geographical
distribution, and sensitivity to environmental
changes, can provide a unique tool for dating
past earthquake events. Geomorphic and hydrologic
changes and dynamic stress resulting from
earthquakes can cause a variety of effects in
trees and communities of trees. Tree-ring
analysis can, produce the actual year and
sometimes the season in which a seismological
disturbance took place. Tree-Rings can also be
used to establish synchroneity between seismic
events that may be beyond the range of absolute
calendar dating. Tree-ring dating can also
establish exact dates based on patterns of annual
ring variations through time. Trees ranging in
age from 300 to 500 years grow in many places and
can be used to identify previously unknown
seismic disturbances or to better define events
that are partially known. Longer time spans can
be covered in some instances. Earthquakes may be
more precisely located in space and time or have
their magnitudes better estimated by analysis of
tree-rings. A number of studies have established
the validity of tree-ring applications in
paleoseismology and a few studies have
contributed new information to the paleoseismic
record.
9
Jacoby, G.C. 1997. Application of tree-ring
analysis to paleoseismology, Reviews of
Geophysics 35 (2) 109-124.
10
(No Transcript)
11
This photo shows trees killed in Cook Inlet,
Alaska by the 1964 earthquake. Beneath them is a
layer of subfossil trees killed by a previous
earthquake. Radiocarbon dating places the event
at about 800 years before present.
The core sample to the right is from a Sitka
spruce (Picea sitchensis) growing just above the
former high tide level on the coast. It is from
a location about 240 km east of the epicenter of
the 1964 Alaska earthquake, the largest
historical earthquake in America. The tree,
growing in unconsolidated sand, was shaken
violently and the root system damaged. The
annual rings show normal growth in 1963 and
abrupt decrease in 1964. The core is 5 mm in
width. Several trees sampled at this location
show a similar response to the event and there
are trees at other coastal locations that show
growth ring changes due to the earthquake. If
the earthquake had been unknown, analysis of all
the trees would have shown disturbance along a
great distance of coastline and a probable great
earthquake.
12
The
photo above shows the Lone Pine Canyon Tree, in
Wrightwood, California. This tree grows directly
on the San Andreas fault. Due to accelerations
and displacement in the earthquake of 1812, the
top broke off and the root system was severely
damaged. For several years there was no radial
growth. When the tree began to recover from the
earthquake, two branches started growing in place
of the snapped-off top. The forked top is one
piece of evidence leading to earthquake induced
damage.
The
chronology above shows reduced growth of the
Lone Pine Canyon Tree. Annual ring widths just
before the 1812 event show normal fluctuations in
growth. From 1813 (noted by the arrow) until the
early 1820s, there was very little growth. Not
until the late 1830s does the tree resume
somewhat normal growth. This pattern of tree
growth confirms the hypothesis that this tree was
damaged by the 1812 earthquake. The photo shows
the actual rings from an increment core of the
Lone Pine Canyon Tree before and after the 1812
earthquake. Note that normal growth does not
being until after the 1830s. This core also shows
evidence of the 1857 earthquake in addition too
the effects of dry years.
TREE-RING LABORATORY,
LAMONT-DOHERTY EARTH OBSERVATORY OF COLUMBIA
UNIVERSITY
13
Long term rupture histories for most faults are
poorly known. Are there patterns That repeat
through time, offering some predictive
capability? One such pattern Seems to be the
east-west sequence of earthquakes shown below.
Most faults do not have such complete records.
This one is known from long historical records,
which also exist in a few other places such as
the Nankai trough in Japan
1939--1967 rupture history of the North
Anatolian fault and GSJ-MTA trenches
14
Slip History Constant or Episodic? Is there a
characteristic pattern or model?
15
Fault Scarp Borah Peak
16
Progessive Faulting
17
Dating Methods
From J. McAlpin, Paleoseismology.
18
Scarp evolution
1954 Fairview Peaks, Nevada M 6.8. Scarp view
in 1984
19
Fault Degradation
20
The usual tools of the trade. Long term history
is limited by how deep you can dig.
21
Trench Cross Section
22
(No Transcript)
23
Reverse Faulting Trench
24
Strike Slip Features
O offset
S sag pond
25
Strike-slip trench
26
Sand blow El Centro, CA1979 Imperial Valley Ca.
Eq.
27
Sand Blow Formation
28
Fossil Sand Blows(Sand Dikes)
Wabash River, Ill
29
Earthquake triggered landslides
Hebgen Lake, 1959
30
Precarious Rocks
31
Coastal Paleoseismology
32
Coastal earthquake cycle in a beach setting
Clam Beach, northern CA
33
Applicability of the Turbidite Method
To test for earthquake origin, one or both
must to be demostrated 1) Individual Event
Origin determined to be earthquake 2) Regional
correlations, cant be anything but an
earthquake Other Factors Fault must be
the sole seismic source Sediment supply,
not too high, not too low Buffering of
sediments, no direct river input! Available
synchronicity tests, Channel confluences
(event count, mineralogy)
34
Observation Other Turbidites
Seismo-Turbidites Sed. Structures Single
Bouma Sequence Amalgamated
beds ---------------------------------------------
--------------------------------------------------
- Grain Size Var. Normal Grading
Normal, inverse, size
breaks -------------------------------------------
--------------------------------------------------
--- Comp. Variation Uniform between beds
Variable between beds,
continuous change within Abrupt changes
beds ------------------------------------
--------------------------------------------------
---------- Composition Terrigenous
component Dominantly marine -----------------
--------------------------------------------------
----------------------------- Source
Single source multiple or line
source -------------------------------------------
--------------------------------------------------
--- Geog. Extent. Single channel
Correlation between
channels ----------------------------------
--------------------------------------------------
------------ Inferred Depo. Single
waning turbidity Multiple surges
or Process current sustained
turbidity currents from
the same or multiple sources
Modified from Shiki et al. 2000
35
What we know about long-term plate boundary
movement comes from field geology and
paleoseismology. Plaeoseismic records can define
the slip rates and recurrence intervals on faults
during the Holocene. As an example, well look
at the Cascadia subduction zone in some detail.
36
(No Transcript)
37
Turbidite Paleoseismology Extending the
earthquake record
Plate Tectonics resolved many questions, but
created many more How do plate boundaries work
really? How do they interact with each other?
Are there models that can describe the
interactions and earthquake recurrence?
Cascadia Core Sites 1999 gray, 2002
yellow Older existing cores white Washington
Channels defined by 8 days of multibeam survey,
now classified!
38
Turbidite Paleoseismology Extending the
earthquake record
Synchroneity Tests. One of the best ways to
determine whether events in separate canyons were
triggered simultaneously is to use a relative
dating technique such as the one shown here.
Triggering in separate canyons causes flows to
merge at a confluence. If these flows are
separated by more than an hour or so, the total
number of events above a given datum will be
greater than the sum of the two tributaries.
Only if triggering was synchronous will the total
event count be the same in all three places.
Only earthquakes are capable of synchronous
triggering over a wide areas, thus the earthquake
origin can be demonstrated.
Cascadia Core Sites 1999 gray, 2002
yellow Older existing cores white Washington
Channels defined by 8 days of multibeam survey,
now classified!
39
Paleoseismology can address these questions
through development of long temporal and spatial
histories of past earthquakes This works better
in the submarine environment than on land because
of continuous sedimentation. The catch its is
harder to demonstrate earthquake origin.
40
Turbidites are easy to capture, but what do they
mean?
41
We correlate turbidites between remote sites to
establish continuity, and test for synchronous
triggering. Correlations are made on the basis of
grain-size/physical property fingerprints
within a 14C age framework
42
Correlation Details San Andreas Margin Cores
12PC qnd 14 PC magnetic susceptibility, Gualala
Channel. Separation distance, 20 km.
12PC
14PC
Event T4
43
Correlation Details Cascadia
T8 3 peaks at all sites
T10 small at all sites
T11 and T16 very large at all sites
13/18
13/18
44
(No Transcript)
45
North
South
The spatial pattern Physical property
correlations are shown by blue dashed lines
between marine sites. Minimum rupture lengths
of past earthquakes can be established with
correlation, and combined with the temporal
pattern and rupture characteristics to generate
an animation of the Holocene event history
(smallest southern Oregon events omitted from
this plot for clarity)
AD1700
46
Cascadia The Movie This sequence shows the
Cascadia Holocene event sequence. The slides
are timed at 1 sec 200 years. Event pulses
that correlate at all sites are shown by flashes
of the locked zone in red. Event size shown
by intensity of red shading
T19
47
T18
48
T17a
49
T17
50
T16a
51
T16
52
T15a
53
T15
54
T14a
55
T14
56
T13
57
T12a
58
T12
59
T11
60
T10R2
61
T10d
62
T10c
63
T10R1
64
T10b
65
T10a
66
T10
67
T9a
68
T9
69
T8
70
T7a
71
T7
72
T6a
73
T6
74
T5c
75
T5b
76
T5a
77
T5
78
T4a
79
T4
80
T3a
81
T3
82
T2a
83
T2
84
T1 (AD 1700)
85
Paleoseismology can be used to establish rupture
lengths, providing an alternative to assumptions
about fault segmentation (guesswork) and
application to margin segmentation
86
So, back to the correlated turbidites. We see
that the magnetic and density signatures can be
traced more than 500 km. But why?
87
Turbidity currents are seemingly chaotic things,
with sediments suspended in a turbulent flow, and
settling out as velocity and turbulence wane.
88
Unscaled experiment showing stratigraphy
developed with multiple pulse input of mixed
sand/silt suspension. Grey sand forms a basal
layer. Yellow layers are a mixture of sand sized
black particles, and silt sized yellow particles.
Input was made with three pulses in 1.0
second. Three pulses, shown with red arrows,
are repeated in the stratigraphy as three fining
upward pulses within a single amalgamated
deposit. Inset shows time function of sediment
input, and grain size distribution based on image
analysis. The point here is that gravity wins,
and heavy materials settle out first regardless
of turbulence
89
Despite the turbulence, settling by grain size
and density are predictable
A
- A. Experimental data for the non-dimensional
length of bidisperse particle-driven gravity
currents released at one end of a channel
containing quiescent ambient fluid. Data points
from Gladstone et al. (1998). - The distribution of the deposit and the
proportions of coarse and fine particles within
it arising from sedimentation from a bimodal
particle-driven gravity current, modeled using
the shallow-water equations The contours are
shown for 80, 60, 40, 20 and 10 of coarse
particles within the deposited material. Also
shown is the total depth of the deposit as a
function of downstream distance. - From Harris et al., 2002.
- The model results imply that multiple pulses
should each have their own set of depositional
curves and should not merge downstream. - The minimum time separation for detection of
grain size depositional changes from separate
pulses is unknown.
A
B
Harris, T.C., Hogg, A.J., and Huppert, H.E.,
2002, Polydisperse particle-driven gravity
currents Journal of Fluid Mechanics, v. 472, p.
333-371.
90
- Conclusions
- Earthquake triggered slides result in turbidites
that have correlatable characteristics - Events can be correlated both within single
channels over long distances, and between
separate channels that never meet. - The correlation of coarse pulses most likely is
related to the earthquake source, since the
channels commonly have different numbers of
tributary pathways, different geology, may not
have any physical connection. We infer that they
are crude paleoseismograms
91
Why do they correlate?
These channels have little in common above the
confluences, so it doesnt seem reasonable to
call upon geologic similarities to account for
the correlation. Our current working
hypothesis is that the physical property patterns
we are correlating are related to the earthquake,
the only thing these sites have in common. How?
We suspect that the signatures represent unique
energy signatures of the source mechanism, a
paleoseismogram
This hypothesis predicts that a long multisegment
rupture like Sumatra, should produce a multipulse
turbidite.
The theoretical basis for this simple, but too
much detail for now
92
So far so good. But can we learn things more
fundamental about how plate boundaries work?
This plot compares turbidite volume to the time
between events, and to the inferred slip,
assuming a full stress drop for each event, and
aslo that turbidite size scales with slip amount
during each earthquake.
Turbidite volume is integrated from the area
under the gamma density curve (relative to a
background value) for each event. Slip is
assumed to scale linearly with time between
events.
93
We make the assumption (possibly wrong) that on
average, turbidite volume is directly
proportional to slip during each megathrust
earthquake. More shaking more turbidite
volume
Surprisingly, there is a close relationship,
establishing a time-predictable model for
Cascadia great earthquakes
94
A time predictable model, over 10,000 years of
record, fits the actual recurrence data quite
well. This means that if this is correct, we
can predict the time, but not the size of the
next Cascadia great earthquake, about 200 years
from now for a full margin rupture, and probably
overdue for a southern margin rupture.
95
NEWS RELEASE 9/17/02 CONTACT Mark Shwartz, News
Service (650) 723-9296 e-mail
mshwartz_at_stanford.edu EDITORS Photos of Murray
and Segall are available at http//newsphotos.stan
ford.edu (slug Murray Segall). Their
study, Testing time-predictable earthquake
recurrence by direct measurement of strain
accumulation and release, will be published in
the Sept. 19 issue of Nature.Relevant Web
URLshttp//kilauea.stanford.edu/paul/
http//kilauea.stanford.edu/jrmurray/
http//quake.wr.usgs.gov/research/parkfield/index
.html http//geopubs.wr.usgs.gov/open-file/of99-5
17/ Study casts doubt on validity of standard
earthquake-prediction model A new study by
Stanford University geophysicists is raising
serious questions about a fundamental technique
for making long-range earthquake predictions.
Writing in the journal Nature, geophysicists
Jessica Murray and Paul Segall show how a widely
used earthquake model failed to predict when a
long-anticipated magnitude 6 quake would strike
the San Andreas Fault in Central California. In
their Sept. 19 Nature study, Murray and Segall
analyzed the "time-predictable recurrence model"
-- a method scientists use to calculate the
probability of future earthquakes. Developed by
Japanese geophysicists K. Shimazaki and T. Nakata
in 1980, the time-predictable model has become a
standard tool for hazard prediction in many
earthquake-prone regions -- including the United
States, Japan and New Zealand. For example, the
U.S. Geological Survey (USGS) relied on the
time-predictable model and two other models in
its widely publicized 1999 report projecting a
70-percent probability of a large quake striking
the San Francisco Bay Area by 2030.
Hmmm, didnt seem to work so well in Parkfield,
along the San Andreas, why not?
96
Maybe the difference is that in Cascadia, the
subduction zone is the larger player, and the
strike slip faults dont play a significant role
in perturbing the stress field, allowing the
intuitive time-predictable model to work The
SAF on the other hand, has other nearby faults,
and is part of a complex plate boundary and cant
operate alone.
Hmmm, didnt seem to work so well in Parkfield,
along the San Andreas, why not?
97
K. Shimazaki http//www.soi.wide.ad.jp/class/20060
029/slides/05/24.html
In the absence of detailed knowledge of what
other fault histories are, one can attempt to
model perturbations from them as brownian
(random) motions. This model is called the
Brownian Passage Time model, BPT. Its very
popular now because there are few faults with
enough data to really get a handle on long term
patterns and interactions. You can also combine
BPT with the time predictable model, as shown
here.
98
But in Cascadia we do have a long enough record
now, and guess what, along the northern San
Andreas, we do also.
99
(No Transcript)
100
(No Transcript)
101
Do Cascadia ruptures trigger the San Andreas?
Very likely yes, within 0-50 years
Cross section
Cascadia ruptures modestly increase Coulomb
static stress, shown here as reds and yellows, on
the northern tip of the NSAF. Combined with a
rupture on the Mendocino Fault, further static
stress increases may occur.
Map view
102
Do Cascadia ruptures trigger the San Andreas?
Very likely yes, within 0-50 years
Cross section
This appears to have happened during 12 of the
last 14 NSAF earthquakes, 1906 being one of
those two. Around AD 1700-1730, a remarkable
series of earthquakes occurred, including
Cascadia, NSAF and the Hayward fault
Map view
103
Do Cascadia ruptures trigger the San Andreas?
Very likely yes, within 0-50 years
Cross section
The time between Cascadia and NSAF events in some
cases could have been minutes, hours, or days.
Visco-Elastic relaxations reduce the stress
interaction after a Cascadia rupture, making it
more likely that the time interval would be short
rather than long (work with R. Burgmann, in
progress).
Map view
104
Submarine Paleoseismology Summary
- General
- Submarine and marine paleoseismic records
together can define rupture length of large
submarine and coastal earthquakes, and has even
been used in lakes. - Turbidite records can link sites through
stratigraphic correlation, and generally go
further back in time. - Long temporal records allow tests of recurrence
models and stress interactions with other fault
systems.
- Cascadia specific
- The repeat time for 19 full Cascadia ruptures is
490 years - The repeat time for all ruptures is 260 years
- Southern Cascadia ruptures much more frequent,
and for 12 of 14 events in 3000 years, seem to be
in sync with the Northern San Andreas - For Cascadia full ruptures, there is a close
correspondence between the following time, and
the size of turbidites, suggesting a
time-predictable model, possibly with
perturbations as in the combined BPT-time
predictable model.
Recommended
CrystalGraphics Presentations


