
Comparing old and new NO2 profiles and tropospheric AMFs for the OMI NO2 algorithm PowerPoint PPT Presentation
1 / 16
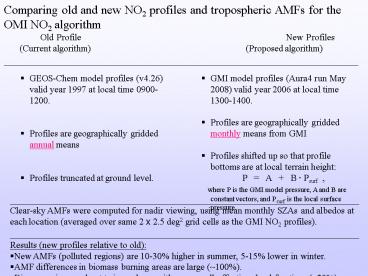
Title: Comparing old and new NO2 profiles and tropospheric AMFs for the OMI NO2 algorithm
1
Comparing old and new NO2 profiles and
tropospheric AMFs for the OMI NO2 algorithm
Old Profile
New Profiles (Current
algorithm) (Proposed algorithm) __________________
__________________________________________________
_
- GEOS-Chem model profiles (v4.26) valid year 1997
at local time 0900-1200. - Profiles are geographically gridded annual means
- Profiles truncated at ground level.
- GMI model profiles (Aura4 run May 2008) valid
year 2006 at local time 1300-1400. - Profiles are geographically gridded monthly means
from GMI - Profiles shifted up so that profile bottoms are
at local terrain height - P A B Psurf ,
- where P is the GMI model pressure, A and B are
constant vectors, and Psurf is the local surface
pressure.
- __________________________________________________
__________________ - Clear-sky AMFs were computed for nadir viewing,
using mean monthly SZAs and albedos at each
location (averaged over same 2 x 2.5 deg2 grid
cells as the GMI NO2 profiles). - __________________________________________________
__________________ - Results (new profiles relative to old)
- New AMFs (polluted regions) are 10-30 higher in
summer, 5-15 lower in winter. - AMF differences in biomass burning areas are
large (100). - Discrepancies are about twice as large with even
small effective cloud fractions (20).
2
Comparison of tropospheric NO2 profiles and AMFs
Figure 1
Black line is GEOS-Chem annual mean profile from
current algorithm. Colored lines are the new GMI
monthly mean profiles. Dotted line is local
terrain pressure.
3
Figure 2
AMF difference (new monthly vs old annual
profiles)
(a) AMFs from GMI monthly mean profiles compared
with AMFs from GEOS-Chem annual mean profiles.
SZAs and albedos are monthly means for each
location.
(b) Same as (a), but GMI monthly means are
compared to GMI annual means.
(c) Same as (b), but using fixed SZA 45 deg,
albedo 0.05.
4
Figure 9
PDFs of tropospheric AMFs near Baltimore,
MD (based on daily GMI NO2 profiles)
- AMFs computed with monthly mean SZA and albedo.
For each month, width of curve shows effect of
daily variation in NO2 profile shape around the
monthly mean. - Same as (a) except using fixed SZA 45 deg and
albedo 0.05.
5
January difference in tropospheric
AMFs Difference (Monthly Annual) / Annual
Figure 3
(a) Monthly means based on GMI profiles,
annual means from GEOS-Chem profiles. (Monthly
mean SZA, albedo and terrain pressure used at
each grid location) (b) Same as (a),
except annual and monthly mean profiles are both
from GMI.
6
July difference in tropospheric AMFs Difference
(Monthly Annual) / Annual
Figure 5
(a) Monthly means based on GMI profiles,
annual means from GEOS-Chem profiles. (Monthly
mean SZA, albedo and terrain pressure used at
each grid location) (b) Same as (a),
except annual and monthly mean profiles are both
from GMI.
7
NO2 AMF vs Surface Reflectivity
8
Annual Mean
OMI (471nm, KNMI)
MODIS (nadir refl at 470nm, BU)
MODIS and OMI have similar spatial
distributions GOMEs big pixel size (100km) makes
its values much higher in tropic forests, mid to
high lat regions due to cloud contamination,
among others
GOME (463nm, Koelemeijer)
9
MODIS-based Product Comparison
Standard product (2004 16-day 0.05DEG CMG, Col5)
BUs custom-made product (5-yr record, monthly
0.05DEG gap-filled CMG)
Aeronet-used dataset (5-yr record, 16-day
0.005DEG, gap-filled)
Hsus LER (5-yr record, 3-season 0.1DEG)
10
Annual Mean Diff btw OMI MODIS (BU)
60
30
0
-30
-60
at 470nm
11
OMIgtMODIS
OMIltMODIS
12
Annual Variation Peak-to-Trough
MODIS 12 month nadir refls at 470nm (BU)
OMI 12 month LERs at 471nm
Aeronet-used nadir refls (23 16-days) at 470nm
GOME 12 month LERs at 463nm
13
April difference in tropospheric AMFs Difference
(Monthly Annual) / Annual
Figure 4
(a) Monthly means based on GMI profiles,
annual means from GEOS-Chem profiles. (Monthly
mean SZA, albedo and terrain pressure used at
each grid location) (b) Same as (a),
except annual and monthly mean profiles are both
from GMI.
14
October difference in tropospheric
AMFs Difference (Monthly Annual) / Annual
Figure 6
(a) Monthly means based on GMI profiles,
annual means from GEOS-Chem profiles. (Monthly
mean SZA, albedo and terrain pressure used at
each grid location) (b) Same as (a),
except annual and monthly mean profiles are both
from GMI.
15
AMFs for April (based on GMI monthly meanNO2
profiles )
Figure 7
(a) Tropospheric NO2 AMFs. Large gradients near
coast and in complex terrain are due to variation
in profile as well as SZA, albedo and terrain
pressure, all of which have been averaged over
the GMI grid cells (2 x 2.5 deg2). In the OMI
algorithm, albedos and terrain pressures are from
a higher-resolution database sampled at OMI pixel
locations.
(b) Same as (a), except SZA, albedo and terrain
pressure are spatially uniform across the field.
The gradients in AMF reflect only the differences
in NO2 profile shape in each of the models 2 x
2.5 deg2 grid cells.
16
Figure 8
Difference in annual mean
tropospheric AMFs Difference (New Old) /
Old Old Based on GEOS-Chem
annual mean NO2 profiles
New Based on GMI annual mean NO2 profiles
Annual mean SZA, albedo and
terrain pressure used in AMF calculation at each
grid location
Recommended
