
Seismic Eruption - forecasting future earthquakes PowerPoint PPT Presentation
Title: Seismic Eruption - forecasting future earthquakes
1
Seismic Eruption - forecasting future earthquakes
2
(No Transcript)
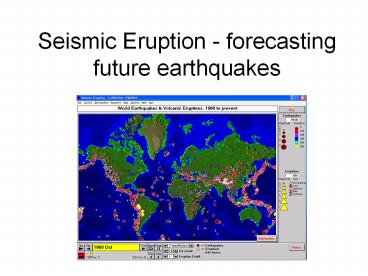
3
- Since my first attachment to seismology, I have
had a horror of predictions and of predictors.
Journalists and the general public rush to any
suggestion of earthquake prediction like hogs
toward a full trough. - - Charles Richter (1977)
4
Whoever wishes to foresee the future must consult
the past
- Turn to you partner and discuss this statement
- What does it mean?
- Provide an example where it applies
- Could this statement connect to earthquakes? How?
5
(No Transcript)
6
(No Transcript)
7
Additional functionality
- Has numerous preset views,
- Investigate global and regional geohazards
- Explore Plate Tectonics via cross-sectional
perspective views of earthquake locations - Is also very customizable
- Make your own map
- Terrain files
- Event files
8
Looking for seismicity patternsSteps
- Select a region of the world that is of interest
to you by making your own map - Interrogate the EQ catalogue to determine the
number of various sized events that occur
annually for your region. (Use M 0.5 intervals) - See Tab 9
- Plot this information on the graph provided (or
use Excel)
9
(No Transcript)
10
Questions
- Do you see any patterns or trends in earthquake
occurrence in your region? - Can you think of any reasons why the trend may be
flat for small magnitudes? - What is the likelihood that an earthquake of
magnitude 7.0 or greater (which can cause severe
damage) will occur in the next year in your
region? - How might this information be useful to society?
- Is there a risk for forecasting earthquake
likelihood using a data set that only goes back
to 1960?
11
(No Transcript)
12
(No Transcript)
13
Questions
- What is the likelihood that an earthquake of
magnitude 7.0 or greater will occur in the next
year in the 2 regions? - How might this information be useful to society?
- Is there a risk for forecasting earthquake
likelihood using a data set that only goes back
to 1973?
14
Are the numbers of earthquakes in the smallest
and largest ranges consistent with the trends in
the other regions? Can you think of any reasons
why the trend is flat for small and also large
magnitudes?
15
2002 National Seismic Hazard Map
16
Although we cant predict earthquakes (in the
sense of predicting a specific time, location and
magnitude) Earthquake Hazard Analysis
Global Seismic Hazard Map
We can estimate the probability that a given
amount of ground shaking will occur during a
given period of time at some location.
17
Summary
- Accommodates student interests by allowing them
to define the temporal spatial limits of their
study. - Simple, easily acquired data set
- Explores the broad topics that lead to a general
understanding of frequency and distribution of
earthquakes - Engages students in the process of science
- Making observations
- Collecting empirical data
- Exploring the limitation of the data
- Organization, graphing and analyzing the data
- Developing logical arguments to support
conclusions - Skeptical review of other students work
18
Guiding Content Questions
- Where do earthquakes occur?
- How frequently do earthquakes occur?
- How frequently do various sized earthquakes
occur? - How does regional tectonics affect distribution
and frequency? - Can past history of Earthquake occurrence
predict future occurrences?
19
Skills Emphasized
- Making observations
- Creating a semi-log graph
- Interpreting and identifying patterns in data.
- Drawing conclusions
- Prediction and hypothesis testing
- Writing a lab report or creating a poster
Recommended
