
Operations Analysis PowerPoint PPT Presentation
Title: Operations Analysis
1
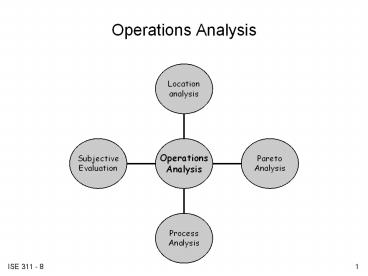
Operations Analysis
2
Location Analysis
- Location of One Item
- Example Locating printer, scanner, copier
station in a department. - Systematic Layout of Multiple Items
- See pp. 114-117
B
2
1
3
4
5
A
3
Pareto Analysis Fight the Giants
- Concept bulk of the problems (opportunities)
are concentrated in a few items - Fight the Giants
- Example causes of long wait times at a health
clinic (data attached.)
4
Process Analysis
- Overview of the process
- Identify opportunities for improvement
- Useful communication tool
- Major types
- Process chart
- single object / person (Ergo disk)
- assembly process
- multi-activity chart (Ergo disk)
- Flow diagram (Ergo disk, Visio)
- Fish (Ishikawa) diagram (Visio)
- Decision structure table
5
Process chart
- Symbology
- Details
- time, distance
- SEARCH
- notes
- Documentation
- Example preparing a form letter for mailing
- see next page
6
In Ergo
7
Flow Diagram
- Usually combined with process chart to visualize
physical space. - Example Preparation and gathering for a design
team meeting. (See next page.)
8
(No Transcript)
9
Other process charts
- Assembly process charts
- show relationships among components, how several
processes interact - useful for methods analysis
- identify delays, storage problems
- example, pg. 121
- Multi-activity chart gang chart, man-machine
chart, left-hand right hand chart - common, scaled time axis
- identify idle time, unbalanced operations
- opportunities for
- job sharing
- double tooling
- kitting
- examples, pg. 123
10
Fish Diagrams
- aka, Ishikawa diagram, Cause Effect diagram
- Useful for brainstorming, identify opportunities
to improve - Head of the fish is the problem or desired
effect - Skeleton identifies potential causes
- 4 Ms manpower, machines, methods, materials
- 4 Ps policies, procedures, people, plant
11
Example
- Improve design team meeting productivity
12
Subjective Evaluation
- Borg Vote Rating of Perceived Exertion (RPE)
- multiply by 10 to estimate heart rate.
6 7 8 9 10 Very, very light Very light How you feel when lying in bed or sitting in a chair relaxed. Little or no effort.
11 12 13 Fairly light Somewhat hard Target range How you should feel with exercise or activity
14 15 16 17 18 19 20 Hard Very hard Very, very hard How you felt with the hardest work you have ever done. Don't work this hard!
13
Subjective Evaluation
- Body discomfort map
- Body portions
14
Body Discomfort Scales
- Borg
- Discomfort scale
- Category partitioning
- See table 9.9, pg. 126
15
Relative and Absolute Scales
- Semantic differential (absolute scale)
- Rate aspects of the workspace, methods, etc. on a
scale between 2 opposite adjectives, - e.g.
- comfortable ___ ___ ___ ___ ___ ___
___ uncomfortable - spacious ___ ___ ___ ___ ___ ___
___ cramped - Alternatively, choose one adjective (acceptable,
comfortable, etc.) and evaluate several aspects
of the workplace, methods, etc. on that one
objective - e.g., acceptability, comfort, etc.
16
Relative and Absolute Scales
- Paired votes (relative)
- Compare two alternatives on a relative ranking
scale, - e.g.
- Visibility of two different computer monitors
- Choose A or B
- Indicate degree of preference
17
Related Concepts
- Evolutionary Operation of Processes (EVOP)
- Designed series of experiments to evaluate the
effects on the output of the process of changing
specific variables - Key idea is to make changes while the process is
active (i.e., not as a separate experiment) - Substitute number of runs for strict control
- Project scheduling
- CPM
- PERT
Recommended
