
LANDSCAPE LEVEL BIODIVERSITY PowerPoint PPT Presentation
1 / 8
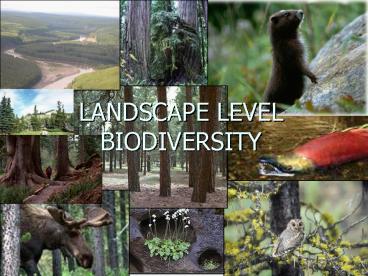
Title: LANDSCAPE LEVEL BIODIVERSITY
1
LANDSCAPE LEVEL BIODIVERSITY
2
Relevant FREP questions
- Are ecosystems represented across the landscape
in time and space? - Is there a sufficient degree of connectivity
among ecosystems? - Are stand-level management objectives for
maintaining biological diversity (e.g., retention
of wildlife trees and coarse woody debris)
adequately contributing to the maintenance of
diverse ecosystems over the landscape?
3
Milestones
- Initial scoping papers completed (L.Kremsater)
- (May-July 2006)
- Working group established (Sept 2006)
- Review, revision and prioritization of DART
tool and indicators (Dec 2006) - Project Charter developed (draft) (Jan 2007)
4
Draft Project Objectives
- TWO Inter-related projects
- To provide quantitative data on a range of
indicators which are generally accepted as
important elements of patterns of natural
disturbance. - To provide landscape-level context to stand-level
biodiversity RSM data through pilot effectiveness
evaluations. - HowProposed Pilots which will
- Critically assess the pilot approach, and apply
this knowledge to developing standardized
procedures for future effectiveness evaluations.
5
Goal 1 Evaluating biodiversity attributes using
current DART indicators
6
Goal 2 Putting FREP stand-level data into a
landscape context
- directed by the goals of stand-level retention
and what is being monitored at the stand-level - need to know the distribution of important stand
level elements across the landscape (i.e., snags,
big trees, and large CWD) - Need to develop predictive attribute
trajectories for different stand ages and forest
types for these elements - Data from literature values, cruise data,
stand-level FREP data - Compare predicted natural abundance of these
structures to actual FREP field data how well
are we doing?
7
(No Transcript)
8
Next steps
- Update DART code to meet current software
standards - Modify DART logic model to incorporate
new/revised indicators and FREP objectives - Develop trajectories for each of the stand level
elements - Pilot implementation in Prince George TSA and
Sunshine Coast TSA
Recommended
