
Results PowerPoint PPT Presentation
1 / 1
Title: Results
1
Examination of the Clinical Utility of MMPI-2
Profiles as Diagnostic Markers Rael T. Lange,
Ph.D., Riverview Hospital, Graeme J. Senior,
Ph.D., University of Southern Queensland,
Lucille A. Douglas, Ph.D., Medical Consultants
Australia (email
rtlange_at_hotmail.com)
Abstract It is generally assumed that
information derived from the MMPI-2 can assist
the clinician in providing clinical diagnoses.
The purpose of this investigation was to examine
whether MMPI-2 profiles can provide
diagnostically relevant information for the
clinician. Participants were 655 (56.9 male)
personal injury claimants divided into six groups
(adjustment disorder, substance abuse, major
depression, chronic pain, post-traumatic stress
disorder, and non-psychiatric controls). Cluster
analyses identified two Basic Scale profiles and
six Content Scale profiles within the entire
sample. However, these profiles included
individuals from all diagnostic groups and failed
to identify a prototypical pattern that
differentiated one diagnostic group from another.
The clinical utility of the Basic and Content
Scales for differentiating between the groups
using discriminant function analysis was poor.
Only 8.3 to 43.4 of the sample were accurately
classified using Basic Scale profiles, while
21.3 to 58.6 were accurately classified using
Content Scale profiles. These results suggest
that clinical diagnoses do not appear to
differentially influence patterns of responding
on the MMPI-2. Introduction It is generally
assumed that information derived from the MMPI-2
can be used to assist the clinician in providing
clinical diagnoses. This contention is grounded
not only in the professional literature, but also
in computer report writers that routinely provide
recommendations for differential diagnosis based
on MMPI-2 responses. The usefulness of the
MMPI-2 as a diagnostic tool is limited by its
capacity to detect and discriminate profiles from
one diagnostic group to another. Differential
diagnoses based on MMPI-2 scores is problematic
because the clinician assumes the existence of a
prototypical pattern of responding that is
characteristic of a particular clinical group.
The purpose of this investigation was to
examine the role of MMPI-2 profiles to provide
diagnostically relevant information. Participants
655 (373 males, 282 females) personal injury
claimants from a forensic psychiatric practice.
Mean Age 40.9 (Sd 10.6) Edn 11.7 (Sd
5.3). Participants were divided into six groups
based on DSM-IV diagnoses made by three
experienced forensic psychiatrists. 1.
Adjustment Disorder (n 182) 2. Substance
Abuse (n 78) 3. Major Depression (n 129)
4. Chronic Pain (n 101) 5.
Post-traumatic Stress Disorder (n 107) 6.
Nil Psychiatric Diagnoses (n 95) Statistical
Analysis Cluster analysis was first used to
identify the number of MMPI-2 Basic and Content
Scale profiles within the entire sample.
Determination of the profiles consisted of a
two-step procedure. Step 1 Method Hierarchi
cal analysis Algorithm Average linkage
method Proximity Measure Correlation
co-efficient Clusters Determined Scree Plots,
Dendrograms, Group membership Validation
Check Independent examiner Step
2 Method K-means cluster analysis Algorithm
Centroid method Proximity Measure Euclidean
distance Internal Validity Multi-profile
multi-method correlation matrix
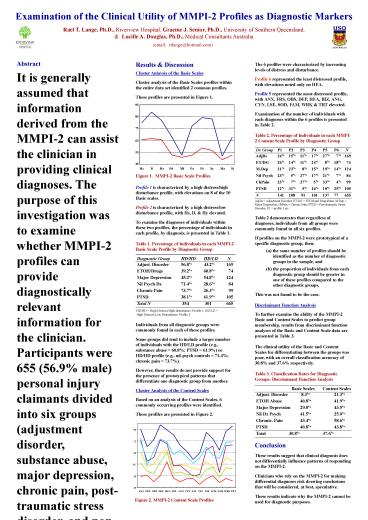
Results Discussion Cluster Anlaysis of the
Basic Scales Cluster analysis of the Basic
Scales profiles within the entire data set
identified 2 common profiles. These profiles
are presented in Figure 1.
The 6 profiles were characterized by increasing
levels of distress and disturbance. Profile 6
represented the least distressed profile, with
elevations noted only on HEA. Profile 5
represented the most distressed profile, with
ANX, FRS, OBS, DEP, HEA, BIZ, ANG, CYN, LSE, SOD,
FAM, WRK TRT elevated. Examination of the
number of individuals with each diagnoses within
the 6 profiles is presented in Table 2. Table
2. Percentage of Individuals in each MMPI-2
Content Scale Profile by Diagnostic Group Dx
Group P1 P2 P3 P4 P5 P6 N AdjDs
24 15 11 17 27 7 169 ET/DG
26 14 11 24 8 18 74 M.Dep 21 23
8 15 19 14 124 Nil Psych 23
5 27 17 21 7 84 ChPain 23 7 27
5 33 4 99 PTSD 12 31 5 16 10 25
105 N 141 108
91 101 137 77 655 AdjDs Adjustment
Disorder ET/DG ETOH and Drug abuse M.Dep
Major Depression ChPain Chronic Pain PTSD
Post-traumatic Stress Disorder P1 profile 1
etc. Table 2 demonstrates that regardless of
diagnoses, individuals from all groups were
commonly found in all six profiles. If profiles
on the MMPI-2 were prototypical of a specific
diagnostic group, then (a) the same number
of profiles should be identified as the
number of diagnostic groups in
the sample, and (b) the proportion of
individuals from each diagnostic
group should be greater in
one of these profiles compared to the
other diagnostic groups. This was
not found to be the case. Discriminant Function
Analysis To further examine the ability of the
MMPI-2 Basic and Content Scales to predict group
membership, results from discriminant function
analyses of the Basic and Content Scale data are
presented in Table 3. The clinical utility of
the Basic and Content Scales for differentiating
between the groups was poor, with an overall
classification accuracy of 30.8 and 37.6
respectively. Table 3. Classification Rates for
Diagnostic Groups Discriminant Function Analysis
Basic Scales Content
Scales Adjust. Disorder 8.3 21.3
ETOH Abuse 40.8 41.9 Major
Depression 29.8 43.5 Nil Dx
Psych 41.5 25.0 Chronic.
Pain 43.4 58.6 PTSD 40.8
43.8 Total 30.8 37.6 Conclusion
These results suggest that clinical diagnosis
does not differentially influence patterns of
responding on the MMPI-2. Clinicians who rely
on the MMPI-2 for making differential diagnoses
risk drawing conclusions that will be considered,
at best, speculative. These results indicate
why the MMPI-2 cannot be used for diagnostic
purposes.
95
85
75
65
55
45
Hs
D
Hy
Pd
Mf
Pa
Pt
Sc
Ma
Si
Figure 1. MMPI-2 Basic Scale Profiles
- Profile 1 is characterized by a high
distress/high disturbance profile, with
elevations on 8 of the 10 Basic scales. - Profile 2 is characterized by a high distress/low
disturbance profile, with Hs, D, Hy elevated. - To examine the diagnoses of individuals within
these two profiles, the percentage of individuals
in each profile, by diagnosis, is presented in
Table 1. - Table 1. Percentage of Individuals in each MMPI-2
Basic Scale Profile by Diagnostic Group - Diagnostic Group HD/HD HD/LD N
- Adjust. Disorder 56.8 43.2 169
- ETOH/Drugs 39.2 60.8 74
- Major Depression 45.2 54.8 124
- Nil Psych Dx 71.4 28.6 84
- Chronic Pain 73.7 26.3 99
- PTSD 38.1 61.9 105
- Total N 354 301 665
- HD/HD High Distress/High disturbance
Profile 1 HD/LD
85
75
65
55
45
35
ANX
FRS
OBS
DEP
HEA
BIZ
ANG
CYN
ASP
TPA
LSE
SOD
FAM
WRK
TRT
Figure 2. MMPI-2 Content Scale Profiles
Recommended
