
Vector Data PowerPoint PPT Presentation
1 / 36
Title: Vector Data
1
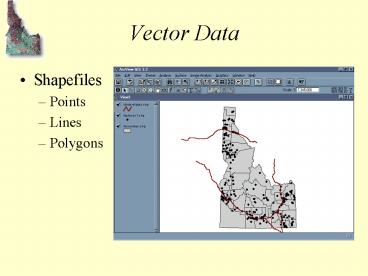
Vector Data
- Shapefiles
- Points
- Lines
- Polygons
2
Raster Data
- Grids, Images, DOQ (digital orthophoto quad),
scanned files, etc.
(Chesterfield, SC)
3
Vector Data Analysis
- Buffering
- Points, lines, or polygons
- Different buffer distances
- Multiple bands
- Overlapped or dissolved zones
4
Vector Data Analysis
- Map Overlay
Point-in-Polygon
Union
Polygon Overlay
Intersect
Line-in-Polygon
5
Combining Attributes After Overlay
- Enumeration Rule
- each attribute preserved in output
- Dominance Rule
- one value wins
- Contributory Rule
- each attribute value contributes
to result
6
Vector Data Analysis
- Map Coverage Manipulation ArcView
dissolve
merge
clip
7
Map Coverage Manipulation
- Dissolve
- Removes boundaries between polygons that have the
same value of a selected attribute.
8
Map Coverage Manipulation
- Clip
- Includes only those features of the input theme
that are within the areal extent of the clip
theme.
clip theme (Upper Salmon River Watershed)
input theme (Idaho counties)
result (watershed divided into counties)
9
Map Coverage Manipulation
- Merge
- Creates a new theme by piecing together two or
more themes however, the boundaries between the
themes remain intact.
Single theme
Separate themes
Snake River Plain Aquifer
Idaho counties
10
Vector Data Analysis
- Map Coverage Manipulation ArcInfo
erase
11
Vector Data Analysis
- Map Coverage Manipulation ArcInfo
split
12
Vector Data Analysis
- Map Coverage Manipulation ArcInfo
update
13
Vector Data Analysis
- Map Coverage Manipulation ArcInfo
eliminate
14
Proximity Analysis
- Distance Measurement ArcView
- Assign data by location
15
Vector Data Analysis
- Distance Measurement ArcInfo
Near
Pointdistance
16
Raster Data AnalysisMap Algebra
- Local Operation
Single grid
Multiple grid (addition)
17
Raster Data Analysis Map Algebra
- Neighborhood Operation
(Rectangular, 3x3)
18
Raster Data Analysis Map Algebra
- Zonal Operation
19
Raster Data Analysis Map Algebra
- Distance Measurement or Global Operation
- Physical Distance
20
Map Algebra Global Functions Based on Euclidean
Distance
21
Map Algebra Euclidean Allocation and Direction
Functions
22
Map Algebra Raster Data Analysis
- Distance Measurement or Global Operation
- Cost Distance
23
Single Raster Analysis Tools
Modules aiming at data exploration within a
single image that go beyond plain visualizations.
24
(No Transcript)
25
(No Transcript)
26
(No Transcript)
27
(No Transcript)
28
(No Transcript)
29
(No Transcript)
30
Map Overlay
31
Comparing images
Differencing Question given are two images
showing the monthly mean temperatures (C) for
Australia in January and in February. What
changes did occur?
32
(No Transcript)
33
Crosstabulation
Imagine two maps (raster images) which tell us
about the landusage of a certain district for two
consecutive years. As a basis for future planings
we need to learn about the changes that occured
in that district. Did forests change? Did they
grow or has their area decreased? What classes do
we meet this year where urban areas have been the
last year? etc.
34
Image Calculator - a multitalent
35
What's the minimum of the seven input images
(IMAGE1 to IMAGE7)? OUTPUT MIN(IMAGE1,
MIN(IMAGE2, MIN(IMAGE3, MIN(IMAGE4,
MIN(IMAGE5, MIN(IMAGE6, IMAGE7)))))) Notice
the nesting of the MIN function - computation
starts from the innermost MIN pair. If you use
trigonometric functions, angle values have to be
converted to radians. This too can be easier by
nesting the commands needed OUTPUT
RAD(COS(IMAGE1))RAD(SIN(IMAGE2)) Simple
computations would take quite a long time doing
it with the functions. 7 calls to OVERLAY and 9
to SCALAR would be necessary in the following
case OUTPUT (((IMAGE11.34-IMAGE23.45) /
(IMAGE15.34IMAGE27.21))
((IMAGE31.24-IMAGE46.5) /
(IMAGE38.7IMAGE42.5))) 25.13 Pay
attention to the parentheses, they determine the
sequence of the calculations. As you realize,
some functions accept the mixing of numbers and
images as input. If you really like, you may only
use numbers with several of the functions, which
turns the Image calculator into a normal
calculator SQR(4)SQR(4) returns? Exactly
32.00000
36
Logical Expresions
We are interested not only in the areas equal to
or above 800 meters but also those below 1000
meters OUTPUT (GAISBERGgt800) AND
(GAISBERGlt1000) Assign all pixels a value of 1
where IMAGE1 is greater than IMAGE2 OUTPUT
IMAGE1 gt IMAGE2 Perform more complex
queries OUTPUT (IMAGE1gtIMAGE2) AND
(IMAGE3gt100) OR (IMAGE2 gt IMAGE3) NOT
(IMAGE1 lt 150)
Recommended
