
MOLECULAR SURFACES PowerPoint PPT Presentation
1 / 11
Title: MOLECULAR SURFACES
1
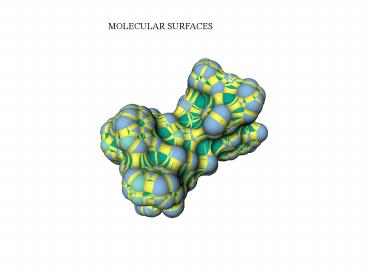
MOLECULAR SURFACES
2
We consider NURBS based data structures for
molecules and their properties, to support
synthetic drug design and structural reasoning
applications in molecular chemistry. The
difficulty of modeling and visualization of large
molecules derives from the high combinatorial
complexity of the typical molecule considered
(e.g. proteins or nucleic acids). There are two
main modeling approaches. The first describes
the molecule's primary structure and the detailed
3D position of each of its atoms. The second
groups some regions of the molecule into simpler
shapes to describe the folding of the molecule
into its secondary, tertiary and higher order
structures. We develop a B-rep data structure
for molecular surfaces that aims to be useful
both for visualization and modeling purposes.
This requires the ability (a) to exactly
represent the shape of the molecule, (b) to
directly render such a representation, and (c) to
perform modeling operations that correspond to
the addition/deletion of residues. The natural
choice to achieve both goals is to use trimmed
NURBS (Non Uniform Rational tensor-product
B-Spline with rational B-Spline trimming curves).
They are an industry-wide standard as a
modeling primitive and graphics libraries for
NURBS rendering are available (e.g. openGL,
OpenInventor). Moreover, the rational
parameterization allows for an exact
representation of a spherical surface. This
alone is not sufficient. In order to have an
exact representation of a macromolecular
structure we also need to represent for each
atom, not its entire sphere, only that portion of
the sphere which belongs to the external molecule
surface. This means that from the sphere which
represents one atom we must cut away the pieces
contained in the neighboring atoms. We prove
that adopting a certain parameterization each
trimming curve (a circle) in the 3D space is
mapped back in the parameter domain to a curve
that can be in turn represented exactly as a
NURBS curve. In this way we can represent the
contribution of each atom to the molecule surface
with a trimmed NURBS patch without any
approximation. The main contributions of the
approach are the definition of a
(minimal size) B-rep with standard trimmed NURBS
representation parametric B-rep model of
the solvent accessible surface useful for
animation the classification of the
solvent contact surface and computation of its
representation as a trimmed NURBS. In the
following you can find a short outline of the
approach. For more details you can download
the paper C. Bajaj, H.Y. Lee, R.
Merkert, V. Pascucci NURBS based B-rep
Models from Macromolecules and their
Properties'', In Proceedings Fourth
Symposium on Solid Modeling and Applications,
Atlanta, Georgia, 1997,C. Hoffmann and W.
Bronsvort Eds., ACM Press. pp. 217-228
3
CPK model, Solvent Accessible and Solvent
Excluded surfaces of the
Nutrasweet Molecule
Given the centers of the molecule atoms and
the relative van der Walls radii we can build the
CPK representation as a union of balls. Its
representation is based on the
corresponding
alpha-shape.
Centers
van der
Waals' radii spheres
Alpha-Shape The solvent accessible surface can
be obtained by increasing the radius of each atom
in the molecule by the radius of the probe sphere
assumed as solvent. A different Alpha-Shape
is associated with the new set of spheres. This
Alpha-Shape and its associated Power Diagram
provide all the topological and geometrical
information
necessary to compute the solvent contact
surface of the molecule.
Solvent Accessible Surface
Corresponding
alpha shape Clipped
power diagram of SAS and original molecule
4
The Solvent Excluded Surface (rolling ball blend)
is obtained by combining parts of the CPK model
with concave and toroidal patches which centers
lie on the curvilinear wireframe
of the solvent accessible surface (the arcs are
the intersection circles between spheres of the
solvent accessible surface). .
CPK model and solvent accessible wireframe
Toroidal and concave patches of the solvent
excluded surface Complete Solvent
Excluded Surface
MORE
MOLECULAR SURFACE MODELS
5
Molecular Interaction Potential The scalar
field given by the interaction energy between a
large receptor molecule and small ligand is
displayed by isocontours of the electrostatic
potential pseudocolored by the Van der Waals
interaction energy.
Inverting the pseudocoloring relationship between
the two potentials further insight is given on
the interaction energy structure.
6
The use of the contour spectrum provides
additional insights. For example smooth surface
that occurs in correspondence of a hi slope
surface area spectrum signature as in Finger
below
corresponds to two a large isocontour that has a
large an important component hidden inside
another. Observing the Spcetrum insight one can
than go to a cutaway view that will show the
significant potential structure that otherwise
would have been missed (see below)
7
The Rasayan Molecular Modelling Toolkit
Rasayan (the Sanskrit word for
Chemistry) is a molecular modeling toolkit
currently under development. It permits the
visualization of molecules and their
structure, and the computation of
topological and geometric information aimed to an
efficient solution of the docking problem. Its
user interface, shown below, is
based on X11 and Motif. Visualization is based on
Open Inventor and OpenGL. It also
allows to perform exact computation of Molecular
Surfaces like the Solvent Accessible, the Solvent
Contact and the Solvent Excluded surface (also
known as the Connolly Surface) with NURBS patches
so that they constitute both a exact boundary
representation of the surface and allows direct
display with standard graphics libraries like
OpenGL.
8
The Rasayan toolkit is based on computation of
the regular triangulation, power diagram and
alpha-shape of a set of weighted points. Points
in this application are centers of atoms, and
weights are the square of their Van der Waals
radii. Examples of weighted alpha-shapes (for
increasing values of the parameter alpha) for the
Nutrasweet molecule are shown below. Weighted
alpha-shapes are described in H.
Edelsbrunner. Weighted Alpha-Shapes''.
Tech Report UIUCDCS-R-92-1760, Dept. of
Computer Science, University of Illinois at
Urbana-Champaign, July 1992. Preliminary results
on the use of alpha-shapes form molecular docking
and similarity can be found in C. Bajaj, F.
Bernardini, K. Sugihara. A Geometric
Approach to Molecular Docking and Similarity''.
Computer Science Tech. Rep., CSD-TR-94-017,
Purdue University, Mar. 1994.
Alpha shape is also used as the basic geometric
data structure for exact Molecular Surfaces
computation C. Bajaj, H.Y. Lee, R.
Merkert, V. Pascucci NURBS based B-rep
Models from Macromolecules and their
Properties'', In Proceedings Fourth
Symposium on Solid Modeling and Applications,
Atlanta,Georgia, 1997,C. Hoffmann and W.
Bronsvort Eds., ACM Press. pp. 217-228
9
5D Molecular Interaction Potential
5D Visualization of Molecular Interaction
Potential
We compute the 5-dimensional scalar field given
by the interaction energy between a small ligand
a nd a large receptor molecule for three
translational degrees of freedom and two
rotational degrees of freedom of the ligand. The
display is performed directly by projection form
5D space to 2D space without an
slicing/isocontouring stage so that the
information contained in the dataset is preserved
in its globality.
10
Consider the coordinate system where one of the
axis (representing one of the rotational degrees
of freedom) is much longer than the others. This
gives the field depicted on the right-top where
in read are depicted the regions of negative
potential (the ligand is free to move in an a
region of attraction from the receptor) in blue
are the regions of hight positive potential (the
ligand collides with the receptor) and in green
are the region of free movement 0-potential
regions. From the picture (stretched along one of
the rotational degrees of freedom) it is clear
that low or high angles (large red spots) are
more favorable for the binding of the two
molecules since the ligand has large regions of
movement.
Removing all the color but the red as in figure
on the left-bottom you can also easily see how
these two large regions are connected by a
narrow tunnel.
11
To get better understanding we need to explore
different view of the dataset. Changing the axis
as in the picture on the left we stretch one of
translational degrees of freedom. This give rise
to the view on the left-top where we can see that
the two large regions are in turn divided each
into two.
On the bottom right one can notice an interesting
site in green where the ligand can move along the
interface with the receptor without being subject
to a repulsion force. Again removing all the
color but the red we can see clearly that in the
central region there are no red spot meaning it
is completely repulsive (see left-bottom image).
Note that this kind of check by partial color
removal is necessary because some red spot might
be hidden in the blue region
Recommended
