
Qqplots PowerPoint PPT Presentations
All Time
Recommended

Linear discriminant classifiers versus decision tree classifiers ... The CART 'bible', providing a theoretical and algorithmic base. A Simple Decision Tree Example ...
| PowerPoint PPT presentation | free to view

Study of the distribution of DCT coefficients in image coding. Johnna Anderson. Shang Xue. Sehee Kim. 2. Outline. Introduction to problem. Example. Project goals ...
| PowerPoint PPT presentation | free to view

The ability of a single or multiple data points, through their presence or ... Traditional OLS summaries can give counter-intuitive results in mixed. Residuals ...
| PowerPoint PPT presentation | free to view

This is simple if we can assume that the data comes from an iid model ... Mean and standard deviation make sense when data sets are not wild ...
| PowerPoint PPT presentation | free to view

18 'study reports' from 13 research groups ... 1. RE model can grossly overestimate (more likely when is close to zero) 2. Var. ...
| PowerPoint PPT presentation | free to view

Survival Curves: Gene PSA model. High ( = 25th percentile) Low ( 25th percentile) ... Royal Hospital for Women. Nigel Hacker. ANU/John Curtin. John Maindonald ...
| PowerPoint PPT presentation | free to view

on a validation data set not used for model building and estimation ... Problem of investigating whether a given null model H0 is compatible with data ...
| PowerPoint PPT presentation | free to view

Labs, accounts, book, S-Plus (2000?), R. The command line is your friend. Moving the labs? ... Approximate Normality is often good 'The Ladder of Transformations' ...
| PowerPoint PPT presentation | free to view
Kriging uses statistical models that allow a variety of map outputs including predictions, prediction standard errors, probability, ...
| PowerPoint PPT presentation | free to download

Normal Quantile Plot ... How this skewness is reflected in the normal quantile plot? ... How do we plot a quantile plot to check on gamma density? ...
| PowerPoint PPT presentation | free to download

Slope of regression line is bi; intercept 0 ... of SDs, invalid t- and F-tests, inefficiency (Ham. p. 113) OA3103, Fall AY 2003. 10/28/02 ...
| PowerPoint PPT presentation | free to view

Title: Anal za dat v GIS Author: Jan Wild Last modified by: hanka Created Date: 12/3/2003 1:49:13 PM Document presentation format: P edv d n na obrazovce
| PowerPoint PPT presentation | free to download

Ecole Sup rieure de la Statistique et de l Analyse de l Information de Tunisie Initialisation au logiciel SAS (Statistical Analysis System) Slim ZOUAOUI
| PowerPoint PPT presentation | free to download
Title: STAT 424/524 Statistical Design for Process Improvement Author: Saihua Yu Last modified by: SZhang Created Date: 8/8/2006 1:45:04 AM Document presentation format
| PowerPoint PPT presentation | free to download

Loi des grands nombres, simulation et m thode de Monte Carlo. Th or me de la limite centr e (TLC). Vecteurs al atoires, loi, ind pendance. Vecteurs gaussiens.
| PowerPoint PPT presentation | free to download

Title: Introduction to SAS Author: LIU PENG Last modified by: Peng Liu Created Date: 3/22/2006 11:23:10 AM Document presentation format: On-screen Show
| PowerPoint PPT presentation | free to view
Transformaci n de Potencia Box-Cox Modelos Estad sticos Dra. Graciela Gonz lez Far as Jos Ram n Dom nguez Molina 14/marzo/2003 Omar Posada Villarreal
| PowerPoint PPT presentation | free to download
We would like to show you a description here but the site won t allow us.
| PowerPoint PPT presentation | free to download
State of the art: many statistical researchers provide their methods as R packages ... vector - A set of elements in a specified order. ...
| PowerPoint PPT presentation | free to download

(elevation, oil spill, air pollution, a chemical in a lake) ... (prediction, error of estimation, quantile map, and probability map) The Geostatistical Analyst: ...
| PowerPoint PPT presentation | free to view
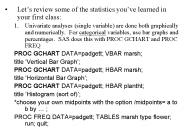
Let s review some of the statistics you ve learned in your first class: Univariate analyses (single variable) are done both graphically and numerically.
| PowerPoint PPT presentation | free to download

3. Hypergeometric distribution. 4. Poisson distribution ... Hypergeometric distribution. A set of N items contains. K items classified as successes and ...
| PowerPoint PPT presentation | free to view

default = print-tip loess ... because: loess normalization doesn't affect the A-values ... but no correction (e.g. normexp) or loess!!! Linear models. design matrix ...
| PowerPoint PPT presentation | free to view

mt.rawp2adjp function ... mt.reject function to list number of genes rejected ... mt.plot function ...
| PowerPoint PPT presentation | free to download

Basics of EDA: Boxplots, Histograms, Scatter plots, Transformations, QQ-plot ... What is EDA? ... a great environment for EDA with great graphics capabilities ...
| PowerPoint PPT presentation | free to download

This is precisely why I turned to the Linux-base Ubuntu! Why Linux and not Windows? ... Ubuntu's webpage describes itself as 'a community developed, Linux-based ...
| PowerPoint PPT presentation | free to view

... there can be clumping caused by the complex underlying genome sequence structure ... ENm001: ENCODE Consortium annotated over 2500 feature-instances ...
| PowerPoint PPT presentation | free to view

Haas School of Business, Berkeley, MFE 2006. Commonly used PROCedures. in Financial Economics ... The CORR procedure computes Pearson correlation coefficients, three ...
| PowerPoint PPT presentation | free to view
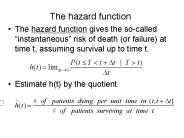
In a real sense it gives the risk of failure (death) per unit time over ... 2.1 - 200 randomly generated exponential variables with mean=100. Characteristic ...
| PowerPoint PPT presentation | free to download
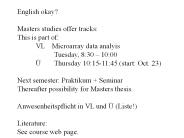
English okay? Masters studies offer tracks: This is part of: ... Global 'whole genome' (yeast, drosophila, mouse, man) Domain specific, e.g. cancer, infection ...
| PowerPoint PPT presentation | free to download

Haas School of Business, Berkeley, MFE 2006. Commonly used ... CLM CSS CV KURTOSIS LCLM MAX MEAN MIN N NMISS RANGE SKEWNESS STD STDERR SUM SUMWGT UCLM USS VAR ...
| PowerPoint PPT presentation | free to view

... Smith School of Business, University of Maryland College ... Need agile methods to allow epidemiologist monitors to change case definitions, make hypotheses ...
| PowerPoint PPT presentation | free to view

[1] 16 14 21 19 18 16 14 12 13 21 20 16 20 22 17 21 14 19 14 19 24 12 ... [26] 26 23 14 18 15 20 21 13 13 19 17 26 16 14 22 19 18 12 21 11 20 12 23 21 18 ...
| PowerPoint PPT presentation | free to view

2. Reading Image into computer. Image formats ascii, binary. DIACOM, MINC, ... Euler characteristic. 9. Random fields. Mean-square convergence. Hilbert space ...
| PowerPoint PPT presentation | free to download

'Integrating the LACFs using 100 days as the upper limit of the integral of Rii(t) ... the t-statistic has Student's t distribution with n 1 degrees of freedom. ...
| PowerPoint PPT presentation | free to view

Matrix multiplication: ... mat -matrix(0,2,3) To make the ... Rows and columns of matrices. You can pick an individual data point, row or column from a matrix ...
| PowerPoint PPT presentation | free to view
R-programming http://www.r-project.org/ http://cran.r-project.org/ Hung Chen Outline Introduction: Historical development S, Splus Capability Statistical Analysis ...
| PowerPoint PPT presentation | free to download

Title: R-programming Author: Hung Chen Last modified by: Jack Yue Created Date: 11/2/2002 3:52:14 AM Document presentation format: Other titles
| PowerPoint PPT presentation | free to download

Univariate analyses (single variable) are done both graphically and numerically. ... INSET MEAN= Mean' (7.2) STD= Standard Deviation' (7.2)/Font= Courier' ...
| PowerPoint PPT presentation | free to download

location: Bioscience Building (New Biology), K065. webpage for ... linux/MacOS/: After defining path where R executables are just type R in one of your windows. ...
| PowerPoint PPT presentation | free to view

... data and the y axis is number of occurrences. Simple plots: qqplot ... runif is a random number generator from the uniform distribution. It is a useful command. ...
| PowerPoint PPT presentation | free to view

Note that the graph of this ecdf is a step function that takes a step at each ... also notice that if all n data values are distinct then the step size is 1/n and ...
| PowerPoint PPT presentation | free to download

S: an interactive environment for data analysis developed at Bell ... Overcomplicated, baroque program architecture... variables a = 49 sqrt(a) [1] 7 ...
| PowerPoint PPT presentation | free to view