
Analyst Meeting - PowerPoint PPT Presentation
1 / 50
Title:
Analyst Meeting
Description:
Title: Management Presentation Author: CII Last modified by: Fiona Coxe Created Date: 8/19/2003 8:13:55 PM Document presentation format: Custom Company – PowerPoint PPT presentation
Number of Views:151
Avg rating:3.0/5.0
Title: Analyst Meeting
1
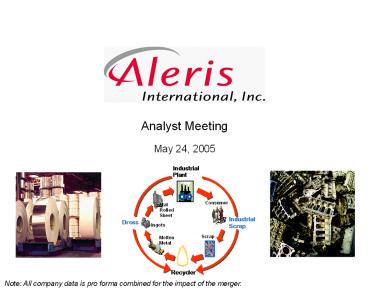
- Analyst Meeting
- May 24, 2005
IndustrialPlant
Consumer
FlatRolledSheet
Industrial Scrap
Dross
Ingots
Scrap
MoltenMetal
Recycler
Note All company data is pro forma combined for
the impact of the merger.
2
Safe Harbor
Statements contained in this presentation that
state the companys or its managements
expectations or predictions of the future are
forward-looking statements intended to be covered
by the safe harbor provisions of the Securities
Act of 1933 and the Securities Exchange Act of
1934. The words believe, expect, should,
estimates, and other similar expressions
identify forward-looking statements. It is
important to note that the companys actual
results could differ materially from those
projected in its forward-looking statements. For
more information concerning factors that could
cause actual results to differ from those
expressed or forecast, see the companys
registration statement on Form S-4 and its annual
report on Form 10-K filed with the Securities and
Exchange Commission.
3
Merger Overview
4
The Merger
December 9, 2004
Revenue 2.4 Billion (1) Headquarters
Beachwood, OH NYSE Symbol ARS
(1) 1Q05 LTM pro forma
5
A New Beginning
December 22, 2004, Ringing the Bell
6
Merger Rationale
- Streamlines cost structure creates value through
synergies - Leverages core competencies transfers best
practices - Enhances metal sourcing capabilities
- Improves competitive position through scale and
scope - Strengthens management enables productivity
improvement - Improves access to capital markets
- Accelerates ability to pursue growth
opportunities
Transformational
7
Initial Strategy
- Relentless Productivity Improvement
- Implement Six Sigma culture to transform
manufacturing productivity - Exploit combined melting and processing
technologies to lower cost - Utilize scrap sourcing capabilities to reduce
purchased metal cost - Extend low-cost continuous cast production to
higher margin products - Core Business Growth
- Pursue U.S. industry acquisition opportunities
- Expand European recycling operations
- Explore Uhrichsville integrated recycling/sheet
footprint in China
Unique Opportunity
8
Acquisition Criteria
- Focus on core rolled product and recycling
businesses exploit capabilities - Diversify end-uses within rolled products and
recycling - Geographic expansion in faster growing economies
of Eastern Europe, South America, Asia and China - Upgrade management talent
- Target greater than 15 IRR
Pursuing Several Opportunities
9
Mission Statement
- To become a leading global provider of
scrap-based aluminum and zinc products and
services focused on generating the highest level
of quality and productivity to exceed stakeholder
expectations - Focus on providing outstanding value to customers
through delivery performance, quality,
competitive prices and innovative product
development
10
Organizational Overview
11
Management Team
Chairman CEO
Steve Demetriou
General Counsel
CFO
Rolled Products
Metal Sourcing
Chris Clegg
Mike Friday
John Wasz
Alan Dick
Human Resources
Aluminum Recycling
Non-Metal Purchasing
Controller
Melissa Olmstead
Bill Lynch
Bob Holian
Treasurer/MA
Asia Pacific
Manufacturing
Sean Stack
NA Aluminum Recycling
Jimmy Chen
Denis Ray
TBD
IT
Jeff Holder
NA Spec Alloys
EHS
Ed Hoag
Ken Willings
Europe
Dieter Koch
R. Scharf-Bergmann
Zinc
Barry Hamilton
Experienced and Proven Value Creators
12
Culture and Key Values
- Sense of urgency - solve todays problems today
- Data driven clearly defined measures
- No bureaucracy
- Minimum layers in organization
- Relentless drive to be more productive in all we
do - Unquestionable integrity
- Global/international
- Recognize great performance
Culture Change Underway
13
Successful Aleris Leader
- Tough but motivating to employees
- Proactive, communicative and value creating to
customers - Aggressive, but fair to suppliers/vendors
- Knows and uses the numbers
- Hands on - able to take on wide span of control
- Honest, candid and highest integrity
- Complementary leadership
Aleris Leaders Can and Will Make a Difference
14
Aleris Transformation
Aleris
Pre-Merger
Future Goal
- Strong Hazelett casting and rotary furnace
technologies - Solid customer base
- Distracted management
- Under-performing
- Untapped potential
- Capital constraints
- Rapid culture change
- Upgrade management
- Increase focus and accountability
- Relentless focus on productivity improvement
- Optimize merger integration / exceed synergy
targets - Improve metal margins
- Revitalized businesses
- Higher quality business mix
- Industry consolidation opportunities
- Double digit EBITDA margins
- ROCE greater than cost of capital
- Strong cash generation
2006 Beyond
Post-Merger
Pre-Merger
Significant Value Creation Opportunity
15
Company Overview
16
Business Overview
Recycling
Spec Alloy
International
Zinc
Rolled Products
- Recycles zinc-bearing secondaries and other zinc
materials to produce zinc oxide, zinc dust and
zinc metal - Major customers - Continental Tire, Dow
Agrosciences, USX, Michelin, Sherwin-Williams - Driven by castings, tire/auto industries and
galvanized steel consumption
- Recycles aluminum dross, new and old scrap
- Major customers Alcoa, Alcan, Arco, Century
- Driven by use of recycled materials and the rigid
container sheet and common alloy sheet sectors
- Recycles, processes and sells aluminum-based spec
alloy - Major customers GM, Contech, DaimlerChrysler,
Ford, Honda, Toyota, Nissan - Driven by increasing usage of aluminum in
automotive sector (particularly castings)
- Recycles aluminum dross and scrap operates spec
alloy facilities - Major customers Alcoa, Alcan, BMW,
DaimlerChrysler, NEMAK, Alunorf - Driven by auto sector in Europe, can sector in
Brazil and industrial growth in Mexico
- Produces common alloy aluminum sheet (with
various thickness, width and physical properties) - Major customers-Alcoa Home Exteriors, Great Dane,
Gentek, Ryerson - Driven by building and construction, consumer
durables, transportation
Sales 533M
Sales 212M
Sales 383M
Sales 1,238M
Note Sales are LTM as of March 31, 2005.
17
Manufacturing Locations
Spokane, WA
Post Falls, ID
Saginaw, MI
Rock Creek, OH
Coldwater, MI
Elyria, OH
Wendover, UT
Bedford, OH
Chicago Heights, IL
Stuttgart, Germany
Uhrichsville, OH
Lewisport, KY
Morgantown, KY
Carson, CA
Rockwood, TN
Clarksville, TN
Loudon, TN
Sapulpa, OK
Goodyear, AZ
Shelbyville, TN
Millington, TN
Houston, TX
Aluminum operations
Zinc operations
Joint venture
Rolled Products operations
Under construction
18
Key Highlights
- Conversion company limited commodity exposure
- Favorable long-term industry trends
- Leading positions in diverse and growing
industries - Superior low-cost business model
- Significant synergy realization opportunity
- Diverse end-use applications
- Significant liquidity
Strong Platform for Cash Flow and Profitability
Growth
19
Limited Commodity Exposure
Rolled Products
Recycling
- Pass-through of metal costs
- Conversion fee based sales model
- Hedging of metal purchases
- Tolling
- Reduced working capital
- 50 of merchant shipments
- Buy / sell
- Utilize hedges to minimize risk
Natural Gas
- Natural gas hedged with contract adjustments and
forward positions - 84 hedged in 2005 at 10-15 below current
prices 45 of 2006 hedged at 20 below current
prices
Commodity Risk Passed to Customers or Hedged
20
Favorable Industry Trends
U.S. Primary Aluminum Supply(1)
Aluminum Content per Vehicle(2)
(pounds)
(1) Source Aluminum Association
(2) Source The Aluminum Association
Recycled Aluminum Provides 95 Energy Savings and
90 Lower Capital Costs vs. Primary
21
Leading Industry Positions(1)
Recycled Aluminum /
Common
Zinc Dust
(
2
)
Spec Alloys
Alloy Sheet
Oxide
Industry Position
1
2
1
U.S. Production
10,000
4,700
530
(millions of lbs)
Primary Competitors
Wabash Alloys
Alcoa
Horsehead
n
n
n
Scepter
Nov
elis
Zochem
n
n
n
Quanex (Nichols)
n
(1) Management estimate (2) Non-heat treat
sheet, excluding can sheet
Well-Positioned in the Improving Industrial
Economy
22
Superior Low Cost Business Model
Scrap Spread Versus P1020 (1)
Cash Conversion Cost Index (2)
/lb
- Scrap spread advantage
- Rotary furnace technology
(1) Source CMMC (2) Management estimate
Vertical Integration of Best-in-Class Melting and
Rolling Technologies
23
Merger Improves Relative Scrap Spreads
- Focusing scrap acquisition on dealers rather than
brokers - Moving upstream to acquire more
customer/industrial scrap directly - Expanded plant network provides favorable freight
dynamics - Acquiring wider basket of scrap types
- Uhrichsville
- One stop delivery provides incentive to dealers
- Better management of supply chain
- Productivity initiatives to improve net molten
metal cost
Aggressively Institutionalizing Additional
Advantage
24
Key Business Drivers
Key Drivers
Aleris Cost Structure (1)
( of sales)
- Volume / capacity utilization
- Scrap spread and availability
- Blending efficiency
- Metal recovery
- Natural gas costs
- Product mix
(1) 1Q05
Focusing on Productivity Opportunities to Drive
Higher Gross Profit
25
Core Competency
Just in Time Molten Metal Delivery is Critical
to Key Customers
26
Core Competency
Continuous Casting Technology is Lowest Cost
27
Synergy Summary
(M)
Area Original Target YTD Annualized Savings New Target Actions
Metal Sourcing 5.0 1.0 6.0 Freight/scrap mix optimization Collect more customer scrap Staff reductions
Non-Metal Purchasing 5.0 4.0 7.0 Casualty/property insurance Travel
Manufacturing 5.0 4.7 10.0 Staff reductions Lewisport improvements Ohio improvements Six Sigma
Shared Services 10.0 11.9 12.0 Staff reductions IT Interest expense Leases
Total 25.0 21.6 35.0
Raising Target to 35M
28
Estimated Synergy Capture Profile (1)
(M)
2005
2006
Total Year
Total Year
2H
2H
1H
1H
35
35
24
15
15
5
Current Yr Impact
0.84
0.84
0.58
0.43
0.43
0.14
Potential /Share Impact
(1) Assumes 11.6 tax rate in 2005 and 26 in
2006 (2) Amounts reflect estimated per share
impact of projected synergies. Such amounts were
calculated by dividing the estimated tax effected
synergies for the period by the number of fully
diluted outstanding shares. Such amounts do not
represent earnings per share projections but
merely represent the potential per share effect
of estimated synergies. Such amounts are not a
GAAP measure.
Synergies will have Significant Impact on Bottom
Line
29
Rolled Products
30
Non-Heat Treat Sheet (NHTS) Products
N. A. Flat-Rolled Products
- Common alloy
- Gutters downspouts
- Residential siding fascia
- Truck trailer siding
- Automotive panels
- Boats marine applications
- Appliances
- Conduit
- Rigid container stock
- Beverage containers
- Packaging
- Caps closures
- Foil fin
- Household foil
- Packaging foil
- Heat exchangers
- Insulation
- Plate
- Rail cars
2004 10.7B lbs
N. A. Common Alloy End-Uses
2004 4.7B lbs
Source Management estimate
31
NHTS Shipments
U.S. Aluminum NHTS Market (billions of pounds)
- Highly correlated with economic growth
- Industrial production
- Housing starts
- Interest rates
- Auto truck build rates
- Material of choice in increasing number of
applications - Architectural roofing
- Truck and trailer
- Automotive
Source Management estimate
Improving Economy Product Substitution Drive
Growth
32
Sources of Scrap Aluminum
Scrap Supply by Sector
Misc.6
- 60 of scrap supply generated from the
manufacturing process - Turnings from production of auto wheels, engine
blocks and heads - Scrap from production of can stock, extrusions
and building products - Gates and risers from the casting process
- Dross
- 40 of scrap supply is post-consumer scrap
- Used beverage cans
- Vehicle components
- Building materials
- Other consumer durables
- 100 of all collected aluminum scrap is recycled
into recovered metal units
Transportation36
Consumer durables20
Buildingand construction16
Packaging and containers22
Wide Diversity of Supply
33
Margin Definitions
Molten Metal
Cost
0.82
Net
Selling
Scrap Cost
LME Cost
P1020 Cost
Price
.78
.80
.86
1.31
Midwest
Metal Margin .49
Premium
0.06
Rolling Margin .45
Scrap
Spread
0.08
- Scrap Spread P1020 scrap cost
- Rolling Margin Net Selling price P1020
- Metal Margin Net selling price molten metal
cost
34
Rolled Products Metal Margin Opportunity
- Priced product at premium to market
- Lost significant sales volume
2003
- Re-priced product to re-gain share lost
- Committed significant volume
- Missed opportunity to realize price increases
- Obtained 2H 04 price increase support
2004
2005
- New 2005 market based contracts in place
- 1Q annualized volume margins at historical highs
(1) 1Q05 volume annualized
Shrinking Supply and Expanding Demand Drives
Improved Margins
35
Favorable Industry Trends
Industry Structural Change
Sheet and Plate Nameplate Industry
Utilization(1)
- 1998 2000 Industry Consolidation
- Alcoa acquired Alumax, Golden Aluminum and
Reynolds - Pechiney acquired Ravenswood (Century)
- Wise Metals acquired Listerhill (Reynolds)
- Michigan Avenue Partners acquired McCook
(Reynolds) - MAP acquired Scottsboro (Norandal)
- 2001 2004 Capacity Restructuring
- 01 MAP shuttered McCook and Scottsboro
- 02 Kaiser declared bankruptcy
- 03 Alcan acquired Pechiney
- 04 Alcoa shuttered San Antonio
- 04 Alcan rolling asset spin off Novelis
- 04 Ormet currently on strike
(1) Source Management estimates
Structural North American Industry Capacity
Utilization Shift
36
Recent Capacity Reductions
(Millions of Pounds)
2002
2003
2004
2005
2006
Cumulative
Curtailments and Shutdowns
Ravenswood
-
(88)
-
-
-
(88)
San Antonio
-
-
(67)
(198)
-
(265)
McCook
(99)
(22)
-
-
-
(121)
Scottsboro
(300)
(99)
-
-
-
(399)
Total Curtailments and Shutdowns
(399)
(209)
(67)
(198)
-
(873)
Total Additions
22
7
74
62
165
Net Change
(399)
(187)
(60)
(124)
62
(708)
Significant Capacity Reduction
37
Financial Summary
38
Recent Performance
(M)
2004 2003
Reported
Revenue 1,226.6 892.0
EBITDA 47.3 48.2
EPS (/share) (1.51) (0.06)
Revenue 2,271.3 1,689.8
EBITDA 132.0 78.5
EPS (/share) 0.16 (0.32)
Proforma excluding special items (1)
(1) Includes results for both companies as if the
merger had occurred on January 1, 2004 and
certain purchase accounting adjustments and
excludes results of Commonwealth Alflex division
sold in July 2004 as well as special items of
restructuring and impairment charges,
mark-to-market FAS 133 derivative and hedge
activity gains and losses and a gain from a
foreign currency transaction. The above proforma
information is shown for informational purposes
and does not conform to Generally Accepted
Accounting Principles (GAAP). Please refer to
our press releases which presented our first
quarter 2005 results and our full year 2004
results dated May 5 and March 15 respectively.
These releases present a reconciliation of the
above data to the comparable GAAP information.
2nd Half 2004 Actions at Rolled Products Drive
Improvements
39
1Q Performance
1Q
(M)
2005 2004
Reported
Revenue 645.0 278.5
EBITDA 56.5 18.2
EPS (/share) 0.94 0.18
Revenue 645.0 524.0
EBITDA 68.5 33.2
EPS (/share) 1.28 0.25
Proforma excluding special items (1)
(1) Includes results for both companies as if the
merger had occurred on January 1, 2004 and
certain purchase accounting adjustments and
excludes results of Commonwealth Alflex division
sold in July 2004 as well as special items of
restructuring and impairment charges,
mark-to-market FAS 133 derivative and hedge
activity gains and losses and a gain from a
foreign currency transaction. The above proforma
information is shown for informational purposes
and does not conform to Generally Accepted
Accounting Principles (GAAP). Please refer to
our press releases which presented our first
quarter 2005 results and our full year 2004
results dated May 5 and March 15 respectively.
These releases present a reconciliation of the
above data to the comparable GAAP information.
Rolled Products and Zinc Drive 1Q Results
40
1Q EBITDA Variance Analysis vs. Last Year (1)
(M - Pro Forma)
(1) Excludes special items
Price/Inflation, Volume/Mix and
Productivity/Synergies All Positive
41
2Q EBITDA Variance Analysis vs. 1Q (1)
(M)
- Aluminum Recycling volume improves from 1Q
- Rolling margins remain at record levels achieved
in 1Q - Productivity ramping up
(1) Excludes special items
Reduced Volume Due to Rolled Products Customers
Inventory Correction
42
Financial Summary
(M)
Adjusted EBITDA(1), (2)
Sales (1)
(1) Pro forma
(2) Adjustments for merger and one-time items
Adjusted EBITDA Improvements Expected to Continue
43
Capex
(M)
Historical and Forecast Capital Expenditures
Key projects
- 2004 - Stuttgart recycling plant 7.2M
- 2005P - Stuttgart completion 14.4M
- Ongoing maintenance spending approximately 35 -
40M
(1) Excludes acquisitions
Opportunity to Lower Base Maintenance Capital
via Sinclair Initiative
44
Cash Debt Summary
(M - Pro Forma)
Improved Operating Performance Will Allow
De-leveraging
45
Corporate Expenses
(M)
1QA 2QF 2HF 2005F 2006F
Corporate SGA 14.0 12.7 24.3 51.0 Lower
Interest expense 10.3 10.5 20.1 40.9 Lower
Tax rate 11.6 11.6 11.6 11.6 26
Realized Corporate SGA Synergies Estimated at 6
- 7 Million for 2005
46
Financial Goals
- Consistent financial performance with cyclicality
muted by ongoing productivity improvements - Double-digit EBITDA (1) margins
- ROCE levels in excess of WACC
- Value creating acquisitions to bolster bottom
line - Strong cash flow
(1) excluding special items
Consistent Step-Change Earnings Performance
Versus Previous Companies
47
2Q05 Outlook
- Underlying economic growth continuing with
exception of automotive - Scrap spreads steady at 1Q05 levels
- Rolling (conversion) margins remain steady
- Most customer inventory correction ending
building construction may lag - 2Q adjusted EPS of 0.90 - 0.95 per share as
guided previously
Reiterating 2Q Guidance
48
2H05 and Full-Year Outlook
- Continued moderate level of GDP growth,
increasing incentives maintain auto production
slightly below last years levels - Continued strong rolled products profitability
- Volume increase vs. 2Q05 average
- Synergy capture accelerates
- Strong cash flow generation
- Total year tax rate at 11.6
2H05 Average Quarterly Adjusted EPS Similar to 2Q
Forecast
49
2006 Highlights
- US GDP continues at moderate 3 rate
- German recycling plant starts up in 1Q
- Commercial/operational improvements take hold in
aluminum recycling - Synergies/productivity provides further savings
- Acquisitions add to bottom line
- Total year tax rate estimated at 26
Forecasting Another Strong Year for Aleris
50
QA
Recommended
CrystalGraphics Presentations


