
Mapping high-resolution incident Photosynthetically Active Radiation over - PowerPoint PPT Presentation
Title:
Mapping high-resolution incident Photosynthetically Active Radiation over
Description:
Mapping high-resolution incident Photosynthetically Active Radiation over Land from satellite observations T. Zheng , D. Wang , S. Liang , S. Running , J ... – PowerPoint PPT presentation
Number of Views:36
Avg rating:3.0/5.0
Title: Mapping high-resolution incident Photosynthetically Active Radiation over
1
Mapping high-resolution incident
Photosynthetically Active Radiation over Land
from satellite observations T. Zheng¹, D. Wang¹,
S. Liang¹, S. Running², J. Townshend¹ and S.
Tsay³ 1University of Maryland, College Park, MD
20742 2 University of Montana, Missoula, MT
59812 ³NASA Goddard Space Flight Center,
Greenbelt, MD 20771
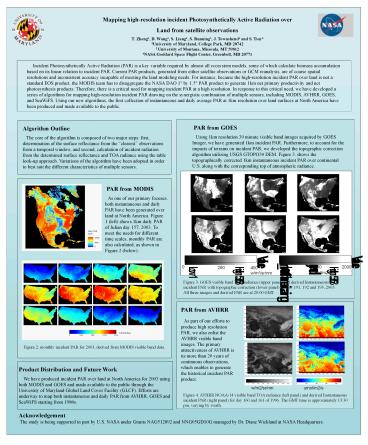
PAR from GOES Using 1km resolution 30 minute
visible band images acquired by GOES Imager, we
have generated 1km incident PAR. Furthermore, to
account for the impacts of terrains on incident
PAR, we developed the topographic correction
algorithm utilizing USGS GTOPO30 DEM. Figure 3.
shows the topographically corrected 1km
instantaneous incident PAR over continental U.S.
along with the corresponding top of atmospheric
radiance.
Algorithm Outline The core of the
algorithm is composed of two major steps first,
determination of the surface reflectance from the
clearest observations from a temporal window,
and second, calculation of incident radiation
from the determined surface reflectance and TOA
radiance using the table look-up approach.
Variations of the algorithm have been adopted in
order to best suit the different characteristics
of multiple sensors.
PAR Algorithm Outline
PAR from MODIS As one of our primary focuses,
both instantaneous and daily PAR have been
generated over land at North America. Figure 1
(left) shows 1km daily PAR of Julian day 157,
2003. To meet the needs for different time
scales, monthly PAR are also calculated, as shown
in Figure 2 (below).
umol/m2/s
Figure 3. GOES visible band TOA radiance (upper
panel) and derived Instantaneous incident PAR
with topographic correction (lower panel) for day
191, 192 and 193, 2005. All three images and
derived PAR are at 2000 GMT.
PAR from AVHRR As part of our efforts to
produce high resolution PAR, we also enlist the
AVHRR visible band images. The primary
attractiveness of AVHRR is its more than 20 years
of continuous observations, which enables to
generate the historical incident PAR product.
Figure 2. monthly incident PAR for 2003, derived
from MODIS visible band data.
w/m2/sr/nm
umol/m2/s
Figure 4. AVHRR NOAA-14 visible band TOA radiance
(left panel) and derived Instantaneous incident
PAR (right panel) for day 160 and 161 of 1996.
The GMT time is approximately 1330 pm, varying
by swath.
Acknowledgement The study is being supported in
part by U.S. NASA under Grants NAG512892 and
NNG05GD10G managed by Dr. Diane Wickland at NASA
Headquarters.
Recommended
CrystalGraphics Presentations


