
OUTCOMES - PowerPoint PPT Presentation
1 / 41
Title:
OUTCOMES
Description:
OUTCOMES Engagement results in achievement Valentine Article 2 activities: 1st Paragraph Importance of 3 words Partners, read Compare Contrast Graphic Organizer – PowerPoint PPT presentation
Number of Views:106
Avg rating:3.0/5.0
Title: OUTCOMES
1
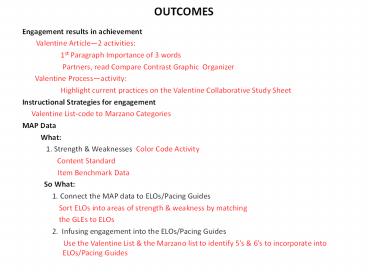
OUTCOMES
- Engagement results in achievement
- Valentine Article2 activities
- 1st Paragraph Importance of 3 words
- Partners, read Compare Contrast Graphic
Organizer - Valentine Processactivity
- Highlight current practices on the Valentine
Collaborative Study Sheet - Instructional Strategies for engagement
- Valentine List-code to Marzano Categories
- MAP Data
- What
- 1. Strength Weaknesses Color Code Activity
- Content Standard
- Item Benchmark Data
- So What
- 1. Connect the MAP data to ELOs/Pacing Guides
- Sort ELOs into areas of strength weakness by
matching - the GLEs to ELOs
- 2. Infusing engagement into the ELOs/Pacing
Guides - Use the Valentine List the Marzano list
to identify 5s 6s to incorporate into
ELOs/Pacing Guides
2
PRODUCTS TO TURN in END OF Day
- Make notes on the Plan of Action
- Evaluate 2010 SMART Goals
- Develop 2011 SMART Goals (develop these from the
notes on the Plan of Action) - --Do you want a SMART Goal around IPI 5 6
Codes? - Be sure to include PD needs
- Monthly PLC Log
3
Welcome
- Good Morning!!!
- Enjoy some refreshments.
4
Origami Warm UP
- MATERIALS Distribute 1 sheet of paper per
participant - ACTIVITY Follow my instructions to fold a sheet
of paper while keeping your eyes closed. - DIRECTIONS
- No questions, no talking
- Fold your paper in half.
- Now, fold it in half again.
- Then, fold it in half one more time.
- Now, rip off the right corner
- Turn your paper over and rip off the upper corner
5
Processing Warm Up
- Unfold your paper, did everyone come up with the
same end result? Why or why not? - How would the results have been different if your
eyes were left open? - What connections can you make to this activity?
What implications are there?
6
Goals for the Day
- What do you want to know from the data?
- What outcome do you want from today and Monday?
7
Achievement Level Data
- If you do what youve always done,
- Youll get what youve always got.
- Comparisons that might inform you
- District to State,
- 2011 District to 2010 District,
- Change in District to change in State.
- Do you have all the data you need?
- Do you know how to access it on SIS for the
students you tested and the students you have
this year.
8
Data Day Overview
FOCUS AREA PURPOSE
IPI Research Using data to identify areas of instructional strengths. How can our strengths inform our practices to improve our areas of weakness?
Instructional Research Validate instructional strengths and add to our instructional toolbox. Using data to identify Professional Development needs.
MAP/EOC IBD Data To connect data to our practices with Pacing Guides and classroom instructional practices
Pacing Guides/ELOs Using data to inform the Pacing Guides ELOs, Proficiency Levels Pacing
9
Focus on Achievement
- On the back of your packet, jot down the factors
that affect student achievement
10
IPI Research Summary A
- What affects student achievement?
- How are each of the following words important in
the 1st paragraph of the IPI Research Summary - Motivation
- Engagement
- Achievement
11
Relationship between Engagement, Motivation, and
Achievement
Student Engagement
Student Achievement
Student Motivation
12
IPI Research Summary
fly
(Valentine Collins)
A.1 Student Engagement IN REGARD TO A.2 Student Disengagement
Relationship to Achievement
Ratios on High Stakes Tests
Long Term Implications
What is the Value of IPI in Lebanon? What is the Value of IPI in Lebanon? What is the Value of IPI in Lebanon?
13
IPI Research Summary
fly
(Valentine Collins)
A.1 Student Engagement IN REGARD TO A.2 Student Disengagement
Relationship to Achievement
Ratios on High Stakes Tests
Long Term Implications
What is the Value of IPI in Lebanon? What is the Value of IPI in Lebanon? What is the Value of IPI in Lebanon?
As engagement increases, achievement increases.
Generally 15-20 increase in Higher
Order/Deeper engagement to a 2-3 increase in
pass rate. Some cases 20 HO/D to pass rate in
6 Comm. Arts, 7 Math Enhanced capacity of
student to think, to learn how to learn, and to
appreciate learning.
As disengagement increases, achievement decreases
2 increase in disengagement to 1 decrease in pass rate
Students ill prepared to enter the workforce or continue formal education. Community suffers, attitudes toward school impacted negatively.
14
VALUE
- VALUE of IPI in the Lebanon School District
Findings affirm that when schools periodically (
3 or 4 times a year) use whole-faculty and/or
sub-group disaggregated methods of data study,
engagement in higher-order/deeper learning
experiences increase as a whole for the school
and the resultant impact on school-wide student
achievement is positive and strong.
15
Days of Lost Learning Time and Percent of IPI
Total Disengagement
Total Percent of Disengagement IPI Category 1 Total Percent of Disengagement IPI Category 1 Total Percent of Disengagement IPI Category 1 Total Percent of Disengagement IPI Category 1 Total Percent of Disengagement IPI Category 1 Total Percent of Disengagement IPI Category 1 Total Percent of Disengagement IPI Category 1 Total Percent of Disengagement IPI Category 1 Total Percent of Disengagement IPI Category 1 Total Percent of Disengagement IPI Category 1 Total Percent of Disengagement IPI Category 1 Total Percent of Disengagement IPI Category 1 Total Percent of Disengagement IPI Category 1 Total Percent of Disengagement IPI Category 1 Total Percent of Disengagement IPI Category 1 Total Percent of Disengagement IPI Category 1 Total Percent of Disengagement IPI Category 1 Total Percent of Disengagement IPI Category 1 Total Percent of Disengagement IPI Category 1 Total Percent of Disengagement IPI Category 1
Days 1 2 3 4 5 6 7 8 9 10 11 12 13 14 15 16 17 18 19 20
170 1.7 3.4 5.1 6.8 8.5 10.2 13.6 15.3 17. 18.7 20.4 22.1 23.8 25.5 27.2 28.9 30.6 32. 32.3 34
This chart provides the opportunity to identify
how many days of instruction are lost when
students are not engaged in learning during
scheduled learning time. This is in addition to
the time at the beginning and end of class and
transistions.
1 to 4 ratio of harm of a one to the good of 5/6
16
Valentine Study Process
- Are we getting the results described in the
summary? - Why or why not?
- If we are getting the results in some areas but
not others, there may be a need to start breaking
out by grade/course and/or content.
17
Maximizing the USE of IPIOnly get the
Achievement Results when the IPI process is
followed entirely.
- 4 times a year optimum (1 waste of time)
- Study data IMMEDIATELY AFTER COLLECTED
- Small/Whole Group Discussion about the Following
- Was it a Typical Day?
- Data Observations (Strengths/Areas of Concern)
- Goals (Set Monitor Specific Goals)
- New Learning (Associated with Instruction)
- Discuss the VALUE of the IPI process analysis
18
(No Transcript)
19
Valentine Study ProcessOnly get the Achievement
Results when the IPI process is followed entirely.
- PLAN OF ACTION
- What You Found
- Jot down the current reality of processing IPI
data in your building - So What Will You Do About It?
- Jot down the steps your building/PLC will begin
to take regarding the complete implementation of
the IPI Process.
20
Plan of Action
Grade Content
Strategy What You Found So What Will You Do About It?
IPI Research ENTER WHAT YOU FOUND ENTER WHAT YOU WILL DO ABOUT IT
MAP/EOC IBD Data
Pacing Guides/ELOs
Instructional Research
21
Factors Influencing Achievement What Works in
Schools Robert Marzano
Check each factor below that connects to IPI.
School Guaranteed and viable curriculum Challenging goals effective feedback Parent and community involvement Safe and orderly environment Staff collegiality and professionalism
Teacher Instructional strategies Classroom management Classroom curriculum design
Student Home atmosphere Learned intelligence and/or background knowledge Motivation
22
School/Teacher Effects on Student Achievement for
a Student Entering School at the 50th Percentile
What
Works in Schools by Robert Marzano
School Teacher Scenario Achievement Percentile After Two Years
Average School Average Teacher
Least Effective School Least Effective Teacher
Most Effective School Least Effective Teacher
Least Effective School Most Effective Teacher
Most Effective School Most Effective Teacher
Most Effective School Average Teacher Marzano, What Works in Schools
50th
3rd
37th
63rd
96th
78th
23
Constructive Classroom Engagement Examples to
Consider and Discuss
Dr. Jerry Valentine
Circle the ones you are currently doing. X the
ones you can consider for your content
Ask each grade/course/individual to share a
strategy from the list they will consider using.
24
Category Explanation of Category
Similarities Differences Engage students in activities that help them examine similaritiesdifferences among ideas, issues, event, etc. 45
Summarizing Note taking Help students to distill and/or synthesize information accurately and concisely. 34
Reinforcing Effort Providing Recognition Help students recognize the relationship between effort achievement. Recognizing students for progress. 29
Homework and Practice Provide opportunities to deepen understanding of content and their proficiency with skills. 28
Nonlinguistic Representations Help students represent and elaborate on knowledge in an imagery form using mental pictures, physical models, graphic organizers etc.27
Cooperative Learning Using grouping strategies to help students learn. 27
Setting Objectives and Providing Feedback Help students understand the direction for learning, establish personal goals, and provide feedback about progress. 23
Generating and Resting Hypotheses Application of knowledge by generating testing hypotheses ex.- problem solving, decision making, investigation, 23
Questions, Cues, Advance Organizers Help students retrieve what they know about a topic using questions, cues, or hints about what is to come. 22
25
Plan of Action
Grade Content
Strategy What You Found So What Will You Do About It?
IPI Research
MAP/EOC IBD Data
Pacing Guides/ELOs
Instructional Research ENTER STRATEGIES MOST IMPORTANT FOR YOUR CONTENT SET A GOAL FOR YOUR PLC
26
Data Day Overview
FOCUS AREA PURPOSE
IPI Research Using data to identify areas of instructional strengths. How can our strengths inform our practices to improve our areas of weakness?
Instructional Research Validate instructional strengths and add to our instructional toolbox. Using data to identify Professional Development needs.
MAP/EOC IBD Data To connect data to our practices with Pacing Guides and classroom instructional practices
Pacing Guides/ELOs Using data to inform the Pacing Guides ELOs, Proficiency Levels Pacing
27
Data Prediction Activity
- Based on your knowledge of what you did in your
PLC/classroom, what strengths do you expect to
find in your data - 1.
- 2.
- 3.
- 4.
- 5.
Compare to the Content Standard Data District to
State District this year to District last year
District for 2011 data, to the District for
those same students in 2010 (their previous
grade) You can look at your current years
students too
28
IBD Data
- On the IBD Data Highlight
- Strengths in green (75 above)
- Areas of concerns in yellow (59 and below)
- For
- 1st the District
- 2nd My Class
- Compare you to the district
- If you are yellow and the district is green, look
for assistance from your PLC. - If you are green and the district is yellow,
offer your ideas to your PLC
29
IBD Data
- Compare the DISTRICT to the STATE
- On the IBD Data Highlight
- In the STATE column, highlight in pink/purple if
the DISTRICT is lower than the STATE - Are these areas of concern too?
30
Plan of Action
Grade Content
Strategy What You Found So What Will You Do About It?
IPI Research
MAP/EOC IBD Data ENTER WHAT YOU FOUND FROM THE DATApick the areas you want to focus on
Pacing Guides/ELOs
Instructional Research
31
Data Day Overview
FOCUS AREA PURPOSE
IPI Research Using data to identify areas of instructional strengths. How can our strengths inform our practices to improve our areas of weakness?
Instructional Research Validate instructional strengths and add to our instructional toolbox. Using data to identify Professional Development needs.
MAP/EOC IBD Data To connect data to our practices with Pacing Guides and classroom instructional practices
Pacing Guides/ELOs Using data to inform the Pacing Guides ELOs, Proficiency Levels Pacing
32
Key Vocabulary
- Essential Learner Outcomes Identifies what the
learner will know and be able to do by the end of
the grade or course. - Pacing Guide Time lines that show what each
teaching team plans to cover over the course of a
year and defines what it takes for a student to
be proficient. - Achievement Level Descriptors Identifies what
students are expected to know and be able to do
at each grade level to be proficient. - Proficiency Indicators A statement that
declares the measureable level of competency that
is expected for an objective/ELO. - Item Benchmark Descriptors An assessment report
that reflect average scores by item for the
state, district, and individual teachers.
33
Essential Learner Outcome GLE/DOK Essential Learner Outcome GLE/DOK Essential Learner Outcome GLE/DOK Essential Learner Outcome GLE/DOK Essential Learner Outcome GLE/DOK Essential Learner Outcome GLE/DOK
Basic Achievement Level Skill Basic Achievement Level Skill
Proficient Achievement Level Skill Proficient Achievement Level Skill
Time Frame for Instruction (How long will it take?) Time Frame for Instruction (How long will it take?)
When will the skill be taught? (Be as specific as possible) When will the skill be taught? (Be as specific as possible)
When will the ELO be assessed? Formative
When will the ELO be assessed? Summative
34
Connecting Data to the Pacing Guide
- Sort the Pacing Guides into those with GLEs in
areas of strength and those with areas of
concern. - You may tally strengths weaknesses under the
GLE in the ELO box - On the pacing guide note the process standard(s)
35
Connecting Data to the Pacing Guide
- AREAS OF STRENGTH
- What did your PLC do?
- Was it a SMART goal?
- What were the 5s 6s you did within that ELO
36
Connecting Data to the Pacing Guide
- AREAS OF CONCERN
- What can be done differently?
- Tie proficiency levels to instructional levels.
- As a PLC develop 5s 6s for areas of concern
- Who in your grade/course/PLC was this area of
concern a strength forwhat did they do? - What areas need to be identified for future
Professional Development?
37
Categories of Strategies that Work Marzano
Classroom Instruction that Works
Strategy GLE of Concern PD Need
Identifying similarities and differences
Summarizing and note taking
Reinforcing effort and providing recognition
Homework and practice
Nonlinguistic representation
Cooperative learning
Setting goals and providing feedback
Generating and testing hypotheses
Questions, cues, and advance organizers
38
Plan of Action
Grade Content
Strategy What You Found So What Will You Do About It?
IPI Research
Instructional Research
MAP/EOC IBD Data
Pacing Guides/ELOs How do these compare to the data Plans to do something about the data. Put ideas for 5s 6s on the back of each Pacing Guide
39
How to View and Print Test Scores for MAP FOR YOUR CURRENT STUDENTS Click on the Display Roster (3 people) icon Click on Assessment for Student Grid (graph) icon at the far right of screen Assessment Area choose MAP (from the drop-down menu) Sub Type Select the subject you want data for (from the drop-down menu) Grid Select all of the scores you want displayed. You can check the box for all scores or manually select the ones you want. Show Section check this box Most Recent Test Instance enter the number of years you want to display Student Name check this box Click the green Update Display button TO PRINT Click the Print (Printer) icon beside the Home (house) icon at the top left of the page. This will print the screen. NOTE If you have multiple pages, you will need to do this for each page you want to print. TO EXPORT to Excel Click the Export to File button on the right side of the screengtchoose XLS file, check the box to Include Column HeadinggtExportgtOpen. To save the file, click FilegtSave As and make the Save as typexls (Excel Workbook). FOR STUDENTS YOU TESTED LAST YEAR Go back to the SIS Home Screen Click ActionsgtMy Login Site-YeargtClick 0910 Note You are now logged into last years data Repeat steps 1-10 above How to View and Print EOC Test Scores FOR YOUR CURRENT STUDENTS Click on the Display Roster (3 people) icon Click on Assessment for Student Grid (graph) icon at the far right of screen Assessment Area choose EOC EXAM (from the drop-down menu) Grid Select all of the fields you want displayed. You can check the box for all scores or manually select the ones you want. Show Section check this box Most Recent Test Instance enter the number of years you want to display Sort Order Student Name check this box to order by name Field choose the field you want to sort by, i.e. choose Scores Level Description to sort by the description (Advanced, Basic) Click the green Update Display button TO PRINT Click the Print (Printer) icon beside the Home (house) icon at the top left of the page. This will print the screen. NOTE If you have multiple pages, you will need to do this for each page you want to print. TO EXPORT to Excel Click the Export to File button on the right side of the screengtchoose XLS file, check the box to Include Column HeadinggtExportgtOpen. To save the file, click FilegtSave As and make the Save as typexls (Excel Workbook). FOR STUDENTS YOU TESTED LAST YEAR Go back to the SIS Home Screen Click ActionsgtMy Login Site-YeargtClick 0910 Note You are now logged into last years data Repeat steps 1-10 above.
40
(No Transcript)
41
PRODUCTS TO TURN in END OF Day
- Make notes on the Plan of Action
- Evaluate 2010 SMART Goals
- Develop 2011 SMART Goals (develop these from the
notes on the Plan of Action) - --Do you want a SMART Goal around IPI 5 6
Codes? - Be sure to include PD needs
- Monthly PLC Log
- FOR VERTICAL TEAM WORK IN NOVEMBER
- Identify/develop instructional strategies at 5s
6s for ELOs that reflect areas of concern.
Record on the back of each ELO.
Recommended
CrystalGraphics Presentations


