
Assessing North Carolina - PowerPoint PPT Presentation
1 / 1
Title:
Assessing North Carolina
Description:
Because the protected areas did not sufficiently cover the ... find the records that lie outside the conserved areas by using the ... Conservation Biology ... – PowerPoint PPT presentation
Number of Views:65
Avg rating:3.0/5.0
Title: Assessing North Carolina
1
Assessing North Carolinas Current Protection of
Amphibian Habitat and Using Amphibian Umbrella
Species to Highlight Areas of Concern
Jaime Neill and Maggie Caswell
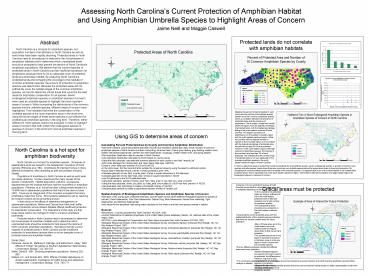
Protected lands do not correlate with amphibian
habitats
Abstract
North Carolina is a hot spot for amphibian
species, but population numbers of amphibians in
North Carolina as well as world wide have been
rapidly declining. Protected lands in North
Carolina need to be analyzed to determine the
inclusiveness of amphibian habitats and to
determine which unprotected lands should be
protected to help prevent the decline of North
Carolina's amphibian populations. We believe that
the current expanse of protected lands in North
Carolina provide insufficient protection for
amphibians because there is not an adequate cover
of protected lands and amphibian habitat. By
analyzing North Carolina's protected lands and
comparing the coverage to the habitats of common
amphibian species, the amount of protection to
amphibian species was determined. Because the
protected areas did not sufficiently cover the
habitat ranges of the common amphibian species,
we tried to determine critical areas that would
be the best areas for amphibian conservation for
all species. Seven endangered amphibian species
or amphibian species of concern were used as
umbrella species to highlight the most important
areas of concern. When comparing the
distributions of the common species and the
umbrella species, different areas of concern were
highlighted. This indicates that while the
conservation of the umbrella species is the most
imperative issue in the short term, using the
home ranges of these seven species is not
sufficient for protecting all amphibian species
in the long term. Therefore, either different or
more species need to be analyzed in order to
highlight areas of concern that both protect the
endangered species or species of concern in the
short term and all amphibian species in the long
term.
Mapping the percent of land protected in each
county and the number of amphibian species
present out of ten common amphibian species,
shows a correlation between the presence of
protected areas and the presence of amphibians.
The mountain, coastal and central piedmont
regions have the highest percentage of protected
lands, with the highest percentage falling in the
most western counties of North Carolina. The
largest occurrence of amphibians is in the
eastern mountain region and the north eastern
piedmont region. While the counties with the
highest number of species in the mountain region
do not correlate with the highest percentage of
protected area, they all have at least 3 of land
protected. However, in the north eastern regions
with high numbers of amphibian species, the
majority of the counties have less than 3 of
land protected. This indicates that the current
range of protected lands is not very adequate for
the average amphibian species in the north
eastern piedmont region of North Carolina.
Using GIS to determine areas of concern
- Calculating Percent Protected Area by County and
Common Amphibian Distribution - Add North Carolina County Boundaries data layer
(NCCB) and Amphibian Distribution data, which
includes 10 common amphibian species of North
America (northern cricket frog, American toad,
Copes gray treefrog, gray treefrog, eastern
newt, eastern red-backed salamander, northern
two-lined salamander, mudpuppy, western lesser
siren, and spring peeper) - Clip Amphibian Distribution data to counties in
North Carolina - Join Amphibian Distribution data table to NCCB
based on county names - Using the field calculator, calculate total
common species for each county in new field
amphib_tot - Add Lands Managed for Conservation and Open Space
data layer (LMCOS) - Create a Union data layer between NCCB and LMCOS
- In the Union layer, find the records that lie
outside the conserved areas by using the select
by attribute function - Export data of selected records, named
Inverse_protected_area (IPA) - Calculate geometry of new field inverse_area of
area in square kilometers in IPA data layer - Calculate geometry of new field total_area of
area in square kilometers in NCCB - Join IPA attributes to the NCCB attributes table
- Using field calculator, subtract inverse_area
from total_area in new field pro_area in NCCB - Using the field calculator, divide pro_area by
total_area and multiply by 100 in new field
percent in NCCB - Use graduated color symbology to create a
chloropleth overlay of percent - Use graduated symbols to create a proportional
symbols overlay of amphib_tot - Spatial Analysis of Endangered Amphibians Species
and Amphibian Species of Concern - Add layer of NC county layer, protected area
layer, and the layers for the seven different
endangered species or species of concern (Dwarf
Salamander, Four-Toed Salamander, Gopher Frog,
Mole Salamander, Neuse River Waterdog, Tiger
Salamander, and Wehrles Salamander)
North Carolina is a hot spot for amphibian
biodiversity
North Carolina is a hot spot for amphibian
species. 35 species of salamanders alone are
present in the Appalachian mountains of North
Carolina (Petranka et al. 364). Amphibians fill
important niches in many different ecosystems,
often operating as both key predator and prey
(Wake). Populations of amphibians in North
Carolina as well as world wide are rapidly
declining. Human impacts are the major causes of
this decline in biodiversity. Habitat
destruction, pollution, and species displacement
are the impacts that have had the most effect on
amphibian populations. Petranka, et al, found
that clear-cutting forests resulted in a 75-80
loss in salamander populations that lived in the
clear-cut area (367). Trees are an integral part
of the mountain ecosystem that many amphibians
make their home. Root systems stabilize the soil
by retaining its moisture content and by
preventing erosion. In their study on the
effects of watershed management on salamander
populations, Willson and Dorcas found that small
buffer zones of protection around stream habitats
offered insufficient protection for salamander
conservation. The implications of this study are
that larger areas need to be managed in order to
conserve amphibian biodiversity. Protected lands
in North Carolina need to be analyzed to
determine the inclusiveness of amphibian habitats
and to determine which unprotected lands should
be protected to help prevent the decline of North
Carolina's amphibian populations. We believe
that the current expanse of protected lands in
North Carolina provide insufficient protection
for amphibians because there is not an adequate
cover of protected lands and amphibian habitat.
In order to determine areas to protect that would
be beneficial for all amphibian species, seven
endangered species or species of concern were
used as umbrella species. Areas where there are
more than one umbrella species should be areas
where there is more land protection. By comparing
the current protected areas with the habitat of
the umbrella species, it is apparent that much of
the critical habitat is not located within
protected areas. This is especially true in the
south eastern piedmont region, where there is
little land protection and large habitat regions
for endangered species or species of concern.
Critical areas must be protected
- Using ten common amphibian species of North
Carolina shows that the current protected areas
vary in suitability depending on the region. - In the mountains the protected areas are doing a
sufficient job but in the north eastern piedmont
there is little land protection and a high number
of amphibian species. - This indicates that there should be more
protection in the north eastern piedmont region. - Comparing the current protected areas with the
habitat distribution of the umbrella species
indicates that there are several suitable areas
for future protection. - Many of these areas are in the south eastern and
north western piedmont regions where there is
little current land protection. - The sandhill area shown in the figure is
important to preserve in the future since it is
the only region in North Carolina with four
umbrella species. - The two different analyses indicate that
different areas need more protection. - While endangered species and species of concern
need to be protected, the differences in these
two maps show that using these seven umbrella
species is not entirely adequate for determining
critical protection areas for all amphibian
species.
Works Cited Petranka, James W., Matthew E.
Eldridge, and Katherine E. Haley. 1993. Effects
of Timber Harvesting on Southern Appalachian
Salamanders. Conservation Biology 7 (2),
363-370. Wake, David B. 1991. Declining amphibian
populations. Science 253, 860. Willson J.D., and
Dorcas M.E. 2003. Effects of habitat disturbance
on stream salamanders Implications for buffer
zones and watershed management. Conservation
Biology. 17(3) 763-771.
- For a more accurate representation of which areas
should be protected to ensure protection of all
North Carolina amphibian species further analysis
is needed. - Either different or more umbrella species should
be used so that their habitat range is a better
representation of all North Carolina amphibians.
Recommended
CrystalGraphics Presentations


