
The IPCC - PowerPoint PPT Presentation
Title:
The IPCC
Description:
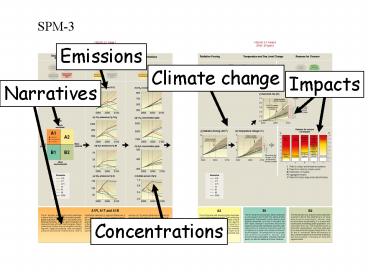
The IPCC s SRES scenarios Emissions Climate change Impacts Narratives Concentrations – PowerPoint PPT presentation
Number of Views:124
Avg rating:3.0/5.0
Title: The IPCC
1
The IPCCs SRES scenarios
2
The SRES driving forces and storylines
Nakicenovic et al. (2000)
3
Emission scenarios (SRES)
- CO2
N2O
SO2
CH4
4
The SRES scenarios global quantifications
IPCC (2001)
5
CO2 Concentration is Rising
6
Radiative Forcing
7
Warming on Continental Scale
Red range Models Black curve
Observations Blue range Models with only natural
forcings
8
Projected Future Warming
9
Regional Warming Patterns
ºC
10
Precipitation Changes
11
Tropical Cyclones
Hurricane Power (PDI)
Sea Surface Temperature (August-October)
Global Mean Temperature
Atlantic
Observed data Hurricane energy closely linked to
SST, and increasing (Emanuel, Nature 2005)
12
IPCC Sea Level Projections
88 cm
IPCC 2007 18 - 59 cm these ranges do not
include uncertainties in carbon-cycle feedbacks
or ice flow processes
70 cm
21 cm
9 cm
Tide Gauges
13
Regional Sea Level
Deviations from global mean sea level rise by 2100
14
Long-term Sea Level Ice Sheets
Volume 2.8x10¹⁵ m3 7 meters of sea level
Ice sheet response time is of the order of
centuries, not millennia. Hansen (2005)
15
Vulnerability Who, to what?
global change
Sectors rely on one or more ecosystem services,
they interact, they are vulnerable.
16
Definition of vulnerability
Vulnerability is a measure of the likelihood of
damage of a system exposed to disturbance e.g. by
global change drivers.
Vulnerability f(Exposure, Sensitivity, Adaptive
Capacity) V f(E, S, AC)
ATEAM, operational definitionVulnerability is
the degree to which an ecosystem service is
sensitive to global change plus the degree to
which the sector that relies on this service is
unable to cope with the changes.
17
The ATEAM methodology
Vulnerability Assessment
multiple scenarios of change in 21st century
climate, land use, N deposition
changes in ecosystem services
changes in adaptive capacity
18
The ATEAM methodology
Vulnerability Assessment
multiple scenarios of change in 21st century
climate, land use, N deposition
changes in ecosystem services
changes in adaptive capacity
19
Exposure multiple stresses
- Climatic change (e.g. temperature rise, change in
precipitation pattern) - Atmospheric greenhouse gas and aerosol
concentration changes (e.g. CO2, methane, soot,
water vapour) - Sea-level rise
- Pollution (e.g. deposition of nitrogen,
phosphorus, sulphur) - Land use change (e.g. abandonment of land)
- Socio-economic change (e.g. markets welfare)
20
Multiple scenarios to span a large range of
possible futures
4 GCMs x (4 SRES 1 natural variation) 20
scenarios of global change per time slice
1990
21
ATEAM scenarios of global change
- Climate change
- Atmospheric CO2 concentration
- Land use change
- N deposition change
- Based on IPCC/SRES
- A1F, A2, B1, B2
- Europe, grid 16 x 16 km,
- 4 time slices
- (1990, 2020, 2050, 2080)
Land use Protected forest. Baseline scenario,
1990.
22
The ATEAM sectors
23
Examples of adaptation
exposure
sensitivity
adaptation
24
Adaptive capacity
- Knowledge
- Awareness
- Understanding
- Will
- Trust
- Motivation
- Values
- Urgency
- Power
- Freedom
- Equity
- Technology
- Wealth
Countries Provinces Cities Villages Sectors Groups
Individuals
25
Fuzzy Logic Approach
Freedom index
Equality
Gini co-efficient
Awareness
Literacy rate
Knowledge
Enrolment ratio
Population density
Urgency
Hazard exposure
Adaptive Capacity
Response
Dependency
Innovation
Unemployment
GDP per capita
Flexibility
Infant mortality
Action
World trade share
Power
Budget surplus
26
Adaptive Capacity
2050
2000
2080
low
high
Recommended
CrystalGraphics Presentations


