
4.7f Product Separation and Recycle - PowerPoint PPT Presentation
1 / 44
Title:
4.7f Product Separation and Recycle
Description:
4.7f Product Separation and Recycle Two definitions of reactant conversion are used in the analysis of chemical reactors with product separation and recycle of ... – PowerPoint PPT presentation
Number of Views:249
Avg rating:3.0/5.0
Title: 4.7f Product Separation and Recycle
1
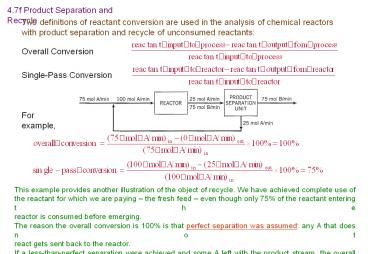
4.7f Product Separation and Recycle
Two definitions of reactant conversion are used
in the analysis of chemical reactors with product
separation and recycle of unconsumed reactants
Overall Conversion
Single-Pass Conversion
For example,
This example provides another illustration of the
object of recycle. We have achieved complete use
of the reactant for which we are paying the
fresh feed even though only 75 of the reactant
entering the reactor is consumed before
emerging. The reason the overall conversion is
100 is that perfect separation was assumed any
A that does not react gets sent back to the
reactor. If a less-than-perfect separation were
achieved and some A left with the product stream,
the overall conversion would be less than 100,
although it would always be greater than the
single-pass conversion.
2
Example 4.7-2
Propane is dehydrogenated to form propylene in a
catalytic reactor The process is to be designed
for a 95 overall conversion of propane. The
reaction products are separated into two streams
the first, which contains H2, C3H6, and 0.555 of
the propane that leaves the reactor, is taken off
as product the second stream, which contains the
balance of the unreacted propane and 5 of the
propylene in the first stream, is recycled to the
reactor. Calculate the composition of the
product, the ratio (moles recycled)/(mole fresh
feed), and the single-pass conversion.
Solution
mole fractions of product stream components
Basis 100 mol Fresh Feed
recycle ratio
single-pass conversion
3
Degree-of-Freedom Analysis
- 3 unknown variables (n6, n7, n8)
- - 2 independent atomic species balances (C, H)
- 1 additional relation (95 overall propane
conversion) - 0 degree of freedom
Overall system
4 unknown variables (n9, n10, n1, n2) - 2
independent molecular species balance (C3H8,
C3H6) 2 degree of freedom
Recycle-fresh feed mixing point
4
5 unknown variables (n1, n2, n3, n4, n5) - 2
independent atomic species balance (C, H) 3
degree of freedom
Reactor
5 unknown variables (n3, n4, n5, n9, n10) -
3 independent molecular species balance (C3H8,
C3H6, H2) - 2 additional relation
(n60.00555n3, n100.05n7) 0 degree of freedom
Separator
Recycle-fresh feed mixing point
(n1, n2)
Overall system (n6, n7, n8)
Separator (n3, n4, n5, n9, n10)
Reactor (n1, n2)
5
95 Overall Propane Conversion ? 5 unconverted
Overall C Balance
6
Overall H Balance
The product contains
7
Given Relations Among Separator Variables
Propane Balance About Separation Unit
8
Propane Balance About Mixing Point
9
Only about 10 of the propane entering the
reactor is converted to propylene in a single
pass however, over 99 of the unconsumed propane
in the reactor effluent is recovered in the
separation unit and recycled back to the reactor,
where it gets another chance to react. The net
result is that 95 of the propane entering the
process is converted and 5 leaves with the
final product.
In general, high overall conversions can be
achieved in two ways (a) design the reactor to
yield a high single-pass conversion, or (b)
design the reactor to yield a low single-pass
conversion (e.g., 10, as in the preceding
example), and follow it with a separation unit
to recover and recycle unconsumed reactant.
The lower single-pass consequently leads to a
decrease in the cost of the reactor. On other
hands, the savings may be offset by the cost of
the separation process unit and the pump, pipes,
and fittings in the recycle line. The final
design would be based on a detailed economic
analysis of the alternatives.
If the first scheme is used, the reactor must
handle a larger throughput, but it takes a much
larger reaction volume to achieve a 95
conversion than 10 conversion in a single pass.
10
4.7g Purging
Suppose a material that enters with the fresh
feed or is produced in a reaction remains
entirely in a recycle stream, rather than being
carried out in a process product. If nothing were
done about this situation, the substance would
continuously enter the process and would have no
way of leaving it would therefore steadily
accumulate, making the attainment of steady
state impossible. To prevent this buildup, a
portion of the recycle stream must be withdrawn
as a purge stream to rid the process of the
substance in question.
Figure 4.7-2
Nitrogen enters the system at a rate of 113 mol/s
and leaves the system at the same rate in the
purge stream. If the system were not purged,
nitrogen would accumulate at this rate until
something probably unpleasant occurred to
shut down the process.
Test Yourself p. 138
Note that the purge stream and the recycle stream
before and after the purge takeoff all have the
same composition.
11
Example 4.7-3
Methanol is produced in the reaction of carbon
dioxide and hydrogen The fresh feed to the
process contains hydrogen, carbon dioxide, and
0.400 mole inerts (I). The reactor effluent
passes to a condenser that removes essentially
all of the methanol and water formed and none of
the reactants or inerts. The latter substances
are recycled to the reactor. To avoid buildup of
the inerts in the system, a purge stream is
withdrawn from the recycle. The feed to the
reactor (not the fresh feed to the process)
contains 28.0 mole CO2, 70.0 mole H2, and 2.00
mole inerts. The single-pass conversion of
hydrogen is 60. Calculate the molar flow rates
and molar compositions of the fresh feed, the
total feed to the reactor, the recycle stream,
and the purge stream for a methanol production
rate of 155 kmol CH3OH/h.
Solution
Basis 100 mol Combined Feed to the Reactor
to be determined for the assumed basis
scaling up by the factor (155 kmol CH3OH/h)/n3
12
Degree-of-Freedom Analysis
7 unknown variables (n0, x0C, n3, n4, np,
x5C, x5H) 1 independent reaction - 5
independent molecular species balances (CO2, H2,
I, CH3OH, H2O) 3 degree of freedom
Overall system
5 unknown variables (n0, x0C, nT, x5C, x5H)
- 3 independent molecular species balances
(CO2, H2, I) 2 degree of freedom
Recycle-fresh feed mixing point
13
4 unknown variables (n1, n2, n3, n4) 1
independent reaction - 4 independent molecular
species balances (CO2, H2, CH3OH, H2O) - 1
single-pass conversion 0 degree of freedom
Reactor
14
3 unknown variables (n5, x5C, x5H) - 3
independent molecular species balances (CO2, H2,
I) 0 degree of freedom
Condenser
2 unknown variables (nr, np) - 1
independent molecular species balances 1
degree of freedom
Purge-recycle splitting point
Reactor
Condenser
Recycle-fresh feed mixing point
Purge-recycle splitting point
15
Reactor Analysis
60 Single-Pass H2 Conversion (? 40 is
unconverted and emerges at the reactor outlet)
H2 Balance consumption input - output
CO2 Balance output input - consumption
16
CH3OH Balance output generation
H2O Balance output generation
17
Condenser Analysis
Total Mole Balance input output
CO2 Balance input output
H2 Balance input output
18
Fresh Feed-Recycle Mixing Point Analysis
Total Mole Balance input output
I Balance input output
CO2 Balance input output
19
Recycle-Purge Splitting Point Analysis
Total Mole Balance input output
20
Flowchart Scaling
For the assumed basis of 100 mol feed to the
reactor, the production rate of methanol is n3
14.0 mol CH3OH. To scale the process to a
methanol production rate of 155 kmol CH3OH/h, we
multiply each total and component molar flow
rate by the factor
21
4.8 Combustion Reactions
Combustion the rapid reaction of a fuel with
oxygen is perhaps more important than any other
class of industrial chemical reactions, despite
the fact that combustion products (CO2, H2O, and
possibly CO and SO2) are worth much less than the
fuels burned to obtain them. The significance of
these reactions lies in the tremendous quantities
of energy they release energy that is used to
boil water to produce steam, which is then used
to drive the turbines that generate most of the
worlds electrical power.
Designing power generation equipment ? mechanical
engineers Designing reactors and controlling
pollution ? chemical engineers
4.8a Combustion Chemistry
Most of the fuel used in power plant combustion
furnaces is either coal (carbon, some hydrogen
and sulfur, and various noncombustible
materials), fuel oil (mostly high molecular
weight hydrocarbons, some sulfur), gaseous fuel
(such as natural gas, which is primarily
methane), or liquefied petroleum gas, which is
usually propane and/or butane.
C ? CO2 or CO H ? H2O S ? SO2 N2 ? NO (at 1800 ?C)
22
A combustion reaction in which CO is formed from
a hydrocarbon is referred to as partial
combustion or incomplete combustion of the
hydrocarbon.
Air is the source of oxygen in most combustion
reactors. Dry air has the following average
molar composition
average molecular weight 29.0
79 N2, 21 O2 79 moles N2/21 moles O2 3.76
moles N2/mole O2
simplifying
100.00
composition on a wet basis ? component mole
fractions of a gas that contains
water composition on a dry basis ? component
mole fractions of the same gas without the water
33.3 mole CO2, 33.3 N2, 33.3 H2O (wet
basis) ? 50 CO2, 50 N2 (dry basis)
23
Example 4.8-1
A stack gas contains 60.0 mole N2, 15.0 CO2,
10.0 O2, and the balance H2O. Calculate the
molar composition of the gas on a dry basis.
Solution
Basis 100 mol Wet Gas
60.0 mol N2 15.0 mol CO2 10.0 mol O2 85.0 mol dry
gas
The product gas that leaves a combustion furnace
is referred to as the stack gas or flue gas.
When the flow rate of a gas in a stack is
measured, it is the total flow rate of the gas
including water on the other hand, common
techniques for analyzing stack gases provide
compositions on a dry basis.
24
An Orsat analysis (a technique for stack
analysis) yields the following dry basis
composition N2 65 CO2 14 CO
11 O2 10 A humidity measurement
shows that the mole fraction of H2O in the stack
gas is 0.0700. Calculate the stack gas
composition on a wet basis.
Solution
Basis 100 lb-moles Dry Gas
7.53 lb-moles H2O 65.0 lb-moles N2 14.0
lb-moles CO2 11.0 lb-moles CO 10.0 lb-moles
O2 107.5 lb-moles wet gas
H2O 0.070 N2 0.605 CO2 0.130 CO
0.102 O2 0.093
Test Yourself p. 145
25
4.8b Theoretical and Excess Air
Combustion reactions are invariably run with more
air than is need to supply oxygen in
stoichiometric proportion to the fuel. The
following terms are commonly used to describe
the quantities of fuel and air fed to a
reactor. Theoretical Oxygen The moles (batch) or
molar flow rate (continuous) of O2 need for
complete combustion of all the fuel fed to the
reactor, assuming that all carbon in the fuel is
oxidized to CO2 and all the hydrogen is oxidized
to H2O. Theoretical Air The quantity of air that
contains the theoretical oxygen. Excess Air The
amount by which the air fed to the reactor
exceeds the theoretical air. Percent Excess Air
If you know the fuel feed rate and the
stoichiometric equation(s) for complete
combustion of the fuel, you can calculate the
theoretical O2 and air feed rates. If in addition
you know the actual feed rate of air, you can
calculate the percent excess air. It is also easy
to calculate the air feed rate from the
theoretical air and a given value of the
percentage excess if 50 excess air is
supplied, for example, then
26
Example 4.8-2
One hundred mol/h of butane (C4H10) and 5000
mol/h of air are fed into a combustion reactor.
Calculate the percent excess air.
Solution
Test Yourself p. 146
100 mol C4H10
6.5 mol O2 required
mol C4H10
h
65 mol O2
4.76 mol air
3.76 moles N2/mole O2
h
mol O2
The theoretical air required to burn a given
quantity of fuel does not depend on how much is
actually burned. The fuel may not react
completely, and it may react to form both CO and
CO2, but the theoretical air is still that which
would be required to react with all of the fuel
to form CO2 only. The value of the percent
excess air depends only on the theoretical air
and the air feed rate, and not on how much O2 is
consumed in the reactor or whether combustion is
complete or partial.
27
4.8c Material Balances on Combustion Reactors
The procedure for writing and solving material
balances for a combustion reactor is the same as
that for any other reactive system. Bear in mind
these points, however 1.When you draw and label
the flowchart, be sure the outlet stream (the
stack gas) includes (a) unreacted fuels
unless you are told that all the fuel is
consumed, (b) unreacted oxygen, (c) water and
carbon dioxide, as well as carbon monoxide if the
problem statement say any is present, and (d)
nitrogen if the fuel is burned with air and
not pure oxygen. 2.To calculate the oxygen feed
rate from a specified percent excess oxygen or
percent excess air (both percentages have the
same value, so it doesnt matter which one is
stated), first calculate the theoretical O2 from
the fuel feed rate and the reaction
stoichiometry for complete combustion, then
calculate the oxygen feed rate by multiplying
the theoretical oxygen by (1 fractional excess
oxygen). 3.If only one reaction is involved, all
three balance methods (molecular species
balances, atomic species balances, extent of
reaction) are equally convenient. If several
reactions occur simultaneously, however such as
combustion of a fuel to form both CO and CO2
atomic species balances are usually most
convenient.
28
Example 4.8-3
Ethane is burned with 50 excess air. The
percentage conversion of the ethane is 90 of
the ethane burned, 25 reacts to form CO and the
balance reacts to form CO2. Calculate the molar
composition of the stack gas on a dry basis and
the mole ratio of water to dry stack gas.
Solution
Basis 100 mol C2H6 Fed
Nitrogen is assumed to be inert.
Degree-of-Freedom Analysis
7 unknown variables (n0, n1, n2, n3, n4, n5,
n6) - 3 independent atomic species balances (C,
H, O) - 1 N2 balance - 1 excess air
specification (relates n0 to the quantity of fuel
feed) - 1 ethane conversion specification - 1
CO/CO2 ratio specification 0 degree of freedom
29
50 Excess Air
50 excess air
100 mol C2H6
3.50 mol O2
1 mol C2H6
90 Ethane Conversion (? 10 unreacted)
25 Conversion to CO
(0.25 ? 90.0) mol C2H6 react to form CO
2 mol CO generated
1 mol C2H6 react
Nitrogen Balance output input
30
Atomic Carbon Balance input output
100 mol C2H6
n1(mol C2H6)
n4(mol CO)
2 mol C
2 mol C
1 mol C
1 mol C2H6
1 mol C2H6
1 mol CO
n5(mol CO2)
1 mol C
1 mol CO2
31
Atomic Hydrogen Balance input output
100 mol C2H6
n1(mol C2H6)
n6(mol H2O)
6 mol H
6 mol H
2 mol H
1 mol C2H6
1 mol C2H6
1 mol H2O
32
Atomic Oxygen Balance input output
525 mol O2
n2(mol O2)
n4(mol CO)
2 mol O
2 mol O
1 mol O
1 mol O2
1 mol CO
1 mol O2
n5(mol CO2)
n6(mol H2O)
2 mol O
1 mol O
1 mol CO2
1 mol H2O
33
The stack gas composition on a dry basis is
The mole ratio of water to dry stack is
34
Example 4.8-4
A hydrocarbon gas is burned with air. The
dry-basis product gas composition is 1.5 mole
CO, 6.0 CO2, 8.2 O2, and 84.3 N2. There is no
atomic oxygen in the fuel. Calculate the ratio
of hydrogen to carbon in the fuel gas and
speculate on what the fuel might be.
Solution
Basis 100 mol Product Gas
Degree-of-Freedom Analysis
4 unknown variables (nH, nC, na, nw) - 3
independent atomic species balances (C, H, O) -
1 N2 balance 0 degree of freedom
35
Nitrogen Balance output input
Atomic C Balance input output
100 mol
0.015 mol CO
1 mol C
1 mol CO
mol
Atomic O Balance input output
Atomic H Balance input output
C/H Ratio in the Fuel
only one hydrocarbon
36
Percent Excess Air
7.5 mol C
29.8 mol H
1 mol O2
1 mol O2
1 mol C
4 mol H
37
4.9 Some Additional Considerations about Chemical
Processes
Textbook process always work the way they are
designed to work. ? Unexpected occurrences are
common, especially when processes are first
run. Textbook process variables are measured with
relatively high precision. ?Every measurement
introduces an error. The invisible process who
run textbook processes never do anything wrong.
?Real process operators and managers, being
human, sometimes make mistakes. In textbooks you
always have exactly the data you need to
determine what you want to know, no matter how
complex the problem may be. ?You may not have
all the data you need and may find it necessary
to use approximate correlations and make
assumption based on common sense and
experience.
38
In textbooks, the closure of every steady-stat
material balance defined as (output/input)?100
is 100. ?Measurement imprecision and
inaccurate assumptions may lead to closures
that differ possibly significantly from 100.
There is no such thing as true steady
state variable values always fluctuate or drift
to some extent. Textbook problems usually have
one and only one correct answer, and your job is
to follow prescribed procedures to determine
it. ?You may have trouble even defining what the
real problem is, and once you have defined
it you can usually find a variety of solutions,
each of which has advantage and
disadvantage. Making the choice involves
considerations of technological capability,
short-range profit, long-range profit, safety,
environmental protection, and ethics.
39
Example 4.9-1
Methyl ethyl ketone (MEK) is to be recovered from
a gas mixture containing 20.0 mole MEK and 80.0
mole N2 at 85?C and 3.5 atm. In a proposed
process design, a stream of this mixture is fed
to a condenser at a rate of 500 L/s and is cooled
at constant pressure, causing most of the MEK to
condense.
40
The design engineer (a) converts the volumetric
flow rate of the feed stream to a molar flow rate
using the ideal gas equation of state, an
approximate relationship between the pressure,
temperature, volumetric flow rate, and molar flow
rate of a gas (Chapter 5) (b) specifies a
condenser temperature of 15?C (c) calculates the
mole fraction of MEK in the vapor product using
Raoults law an approximate relationship
between the composition of liquid and vapor
phases in equilibrium with each other at a
specified temperature and pressure (Chapter 6)
and (d) calculates the molar flow rates of the
vapor and liquid products from nitrogen and MEK
balances (input output). The results follow.
41
A condenser is then installed and run at the
design temperature and pressure. The volumetric
flow rates of the feed stream and the vapor and
liquid product streams are measured with
rotameters, and the MEK mole fractions in the
feed and vapor effluent streams are measured with
a gas chromatograph. The feed stream flow rate is
set to 500 liters/s and enough time is allowed to
pass for the product stream rotameter readings to
reach steady-state levels. The feed and product
liquid flow rate is converted to a molar flow
rates using the ideal gas equation of state, and
the product liquid flow rate is converted to a
molar flow rate using a tabulated MEK density
and the molecular weight of MEK. Here are the
results. 1.Calculate the MEK balance
closures for the condenser design and the
experimental condenser. 2.List possible
reasons for the differences between the design
predictions and the experimental values of
the output stream variables and for the failure
of the experimental system balance to close.
42
Solution
1.Material balance closures.
Design
The nitrogen balance closure is also 100.
43
Experiment
The nitrogen balance closure is 95.
44
2.Possible reasons for differences between design
values and experimental values. Human errors,
instrument errors, and random data scatter.
Impurities in the feed. Incorrect assumption
of steady state. Incorrect assumption that MEK
is not reactive. Errors due to approximations
in the experimental data analysis.
Approximations in the design analysis.
The point is that no matter how carefully you
design a process, you cannot predict exactly what
the real process will do. Approximations and
assumptions must be made for every process
design closures on real process material
balances are never exactly 100 nothing can be
measured with complete accuracy and everyone
sometimes makes mistakes.
Experienced design engineers know these things
and account for them with overdesign factors. If
they calculate that they need a 2500-liter
reactor, they might order a 3000-liter or
3500-liter reactor to make sure they have enough
reactor capacity to meet both current and
anticipated product demands. The more
uncertainties in the design or the projected
product demand, the greater the overdesign. A
large part of what engineers do involves reducing
the uncertainties and thus lowering the required
overdesign, resulting in major reductions in
equipment purchase and maintenance costs.
Recommended
CrystalGraphics Presentations


