
Reservoirs - PowerPoint PPT Presentation
1 / 32
Title:
Reservoirs
Description:
Ashokan Reservoirs Kensico Balancing Supply and Demand Hillview Croton Reservoir Spillway Water Supply and Demand Fluctuations Supply Seasonal supply fluctuations ... – PowerPoint PPT presentation
Number of Views:184
Avg rating:3.0/5.0
Title: Reservoirs
1
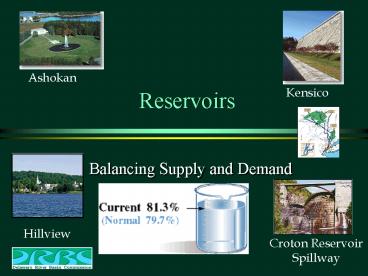
Reservoirs
Ashokan
Kensico
- Balancing Supply and Demand
Hillview
Croton Reservoir Spillway
2
Water Supply and Demand Fluctuations
- Supply
- Seasonal supply fluctuations
- Buffered using _________ reservoirs
- Demand
- Seasonal demand fluctuations
- Daily demand fluctuations
- Buffered using _________ reservoirs
- Effect of flow fluctuations on system design
- Size of balancing reservoirs
- pipe sizes
watershed
distribution
3
Average Total Monthly Flow into Pepacton
Reservoir (0.540 km3 storage)
Reservoir full (hopefully)
140
120
100
80
Million m3/month
average
60
40
20
0
Deficit provided by storage
July
May
March
January
November
September
____ million m3/month __ month ___ million m3
38
190
5
Better design is based on drought conditions!
4
What is the safe yield from the Cannonsville
Reservoir?
- What is the maximum rate that we can withdraw
water from the Cannonsville Reservoir without
emptying the reservoir?__________________________
_______ - What are the critical events in history that
determine how big the reservoir has to
be?__________
The average stream flow into the reservoir.
Droughts
5
Reservoir Mass Balance Equations
Storage
Cumulative Inflow
Initial storage
Cumulative Outflow
O Cumulative (________ _________
___________ )
Demand
River flow
Evaporation
True at any time!
or
Ii
Di
6
Density of Water
Density (mass/unit volume) r density of water
1000 kg/m3
7
Downstream River Flow?
- Simplest operating rule
- Waste from reservoir when reservoir is full
- Dont waste from reservoir if reservoir isnt
full - More complex rules could easily be incorporated
into a spreadsheet model - Minimum discharge into stream as a function of
reservoir storage volume or ______________ - Based on regulations
drought status
8
Reservoir Rules in Equation Form
When Si Smax
When is reservoir full? ___________________
Reservoir is overflowing
Overflow goes into river
No additional river flow
Reservoir Capacity
Smax
9
Cannonsville Reservoir Storage (Demand of 1.04 x
106 m3/day)
How could we increase safe yield?
Increase reservoir volume
10
Storage vs. Safe Yield for Cannonsville Reservoir
What is the asymptote?
Average stream flow
safe yield
(million m3/day)
367
storage volume (million m3)
11
NYC Reservoirs
- NYC supply reservoirs have a storage capacity of
550 billion gallons (2 km3) - How long could NYC go without any inflow into the
reservoirs? - Current Reservoir levels (http//www.ci.nyc.ny.us/
nyclink/html/dep/html/current.html)
solution
Reservoir Levels
12
Empty NYC Reservoirs?
- What happens as Reservoir Levels drop?
- __________________________________
- __________________________________
- __________________________________
- __________________________________
- __________________________________
Nutrient levels increase (less dilution)
Algae grows (taste and odors)
Water quality deteriorates
Shorter residence time (less time for pathogens
to die)
Drought watch
13
Seasonal, Daily, and Hourly Fluctuations
- Substantial increase in water demand during
summer due to_______________________ - Peak flows______________________________________
_____________________ - Low flows______________________
watering lawns, swimming pools
Early morning as people get ready to go to
work/school
Commercial Breaks (not any more)
Between midnight and 5 am
14
Estimates of Daily and Hourly Fluctuations
- As the time period of analysis decreases in
length the maximum rate of water demand during
that time period __________ - If the average annual flow rate is 1.0 then
- the maximum season rate is 1.25 (summer)
- the maximum daily rate is 1.5 (range of 1.2-2.0)
- the maximum hourly rate is 2.5 (range of 1.5-3.5)
- for NYC the maximum instantaneous rate was _____
increases
1.75
Henry and Heinke p 386
15
Methods to Even Out Fluctuations
- Seasonal fluctuations
- Source (watershed) reservoirs
- Kensico and West Branch Reservoirs
- Daily fluctuations
- Hillview and Jerome Park Reservoirs (directly
connected to distribution tunnels) - Hillview has 3.4 million m3 useable storage
- Flows from Kensico to Hillview are adjusted every
________
two hours
16
Balancing Reservoirs
OK Fred, Ill go give it another turn. Did you
say you have more water than you need?
Hey Bob, I need some more water. Could you open
the valve another turn?
Where are the largest tunnels in the NYC water
supply and distribution system?
17
How Can You Estimate Required Balancing-Reservoir
Capacity?
- Variable supply
- Variable demand
- Analyze historic record to search for worst case
conditions - Use same Mass Balance analysis
- Include variable ________ in analysis
- Other unusual demands
demand
Fire fighting needs
Maintenance of supply tunnels
Main breaks
18
Summary
- An understanding of the variability in supply and
demand are essential for the sizing of reservoirs
and pipes in a water supply system - Supply Reservoirs must be sized to store water
during drought periods - Balancing Reservoirs must be sized for daily or
hourly fluctuations - Distribution pipes must be sized to handle peak
flows
19
Catskill/Delaware Watersheds
Schoharie
Cannonsville
Pepacton
Ashokan
Roundout
Neversink
20
NYC Watersheds
21
Croton System
22
Ashokan Reservoir
23
Schoharie Reservoir
24
Neversink Reservoir
25
West Branch Reservoir
26
City Tunnels
27
Jerome Park Reservoir
28
Gaging Stations
29
Empty NYC Reservoirs
- NYC supply reservoirs have a storage capacity of
550 billion gallons (2 km3) - Average demand is 61 m3/s
- How long could NYC go without any inflow into the
reservoirs?
30
Cannonsville Reservoir Storage (Demand of 0.5 x
106 m3/day)
Stream flow gage station map
31
Cannonsville Reservoir Storage (Demand of 0.75 x
106 m3/day)
32
Cannonsville Reservoir Storage (Demand of 1 x 10⁶
m3/day)
Recommended
CrystalGraphics Presentations


