
Virtual Instrumentation With LabVIEW - PowerPoint PPT Presentation
1 / 60
Title:
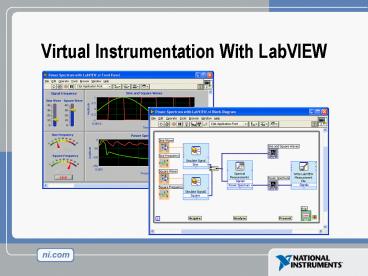
Virtual Instrumentation With LabVIEW
Description:
Virtual Instrumentation With LabVIEW ... Visual Basic, C++, JAVA, and most other text-based programming languages follow a control flow model of program execution. – PowerPoint PPT presentation
Number of Views:131
Avg rating:3.0/5.0
Title: Virtual Instrumentation With LabVIEW
1
Virtual Instrumentation With LabVIEW
2
Course Goals
- Understand the components of a Virtual Instrument
- Introduce LabVIEW and common LabVIEW functions
- Create a subroutine in LabVIEW
- Work with Arrays, Clusters, and Structures
- Develop in Basic Programming Architectures
3
Section I
- LabVIEW terms
- Components of a LabVIEW application
- LabVIEW programming tools
- Creating an application in LabVIEW
4
LabVIEW Programs Are Called Virtual Instruments
(VIs)
- Front Panel
- Controls Inputs
- Indicators Outputs
- Block Diagram
- Accompanying program for front panel
- Components wired together
5
VI Front Panel
Front Panel Toolbar
Icon
Boolean Control
Graph Legend
Waveform Graph
Scale Legend
Plot Legend
6
VI Block Diagram
Block Diagram Toolbar
Divide Function
SubVI
Graph Terminal
Wire Data
While Loop Structure
Numeric Constant
Timing Function
Boolean Control Terminal
7
Express VIs, VIs and Functions
- Express VIs interactive VIs with configurable
dialog page - Standard VIs modularized VIs customized by
wiring - Functions fundamental operating elements of
LabVIEW no front panel or block diagram
Function
Standard VI
Express VI
8
Controls and Functions Palettes
Controls Palette (Front Panel Window)
Functions Palette (Block Diagram Window)
9
Tools Palette
- Floating Palette
- Used to operate and modify front panel and block
diagram objects.
Automatic Selection Tool
Scrolling Tool Breakpoint Tool Probe Tool Color
Copy Tool Coloring Tool
Operating Tool Positioning/Resizing Tool Labeling
Tool Wiring Tool Shortcut Menu Tool
10
Status Toolbar
Run Button Continuous Run Button Abort
Execution Pause/Continue Button Text
Settings Align Objects Distribute
Objects Reorder Resize front panel objects
Additional Buttons on the Diagram Toolbar
Execution Highlighting Button Step Into
Button Step Over Button Step Out Button
11
Do Not Delete This Slide
12
Open and Run a Virtual Instrument
Example finder
13
Creating a VI
Front Panel Window
Block Diagram Window
Control Terminals
Indicator Terminals
14
Creating a VI Block Diagram
15
Wiring Tips Block Diagram
Wiring Hot Spot
Click To Select Wires
Use Automatic Wire Routing
Clean Up Wiring
16
Do Not Delete This Slide
17
Dataflow Programming
- Block diagram executes dependent on the flow of
data block diagram does NOT execute left to
right - Node executes when data is available to ALL input
terminals - Nodes supply data to all output terminals when
done
18
Help Options
- Context Help
- Online help
- Lock help
- Simple/Complex Diagram help
- Ctrl H
- Online reference
- All menus online
- Pop up on functions in diagram to access online
info directly
19
Do Not Delete This Slide
20
Exercise 1 - Convert C to F
21
Debugging Techniques
- Finding Errors
- Execution Highlighting
- Probe
Click on broken Run button Window showing error
appears
Click on Execution Highlighting button data flow
is animated using bubbles. Values are displayed
on wires.
Right-click on wire to display probe and it shows
data as it flows through wire segment You can
also select Probe tool from Tools palette and
click on wire
22
Section II SubVIs
- What is a subVI?
- Making an icon and connector for a subVI
- Using a VI as a subVI
23
Block Diagram Nodes
Icon Expandable
Node Expanded Node
- Function Generator VI
- Same VI, viewed three different ways
- Yellow field designates a standard VI
- Blue field designates an Express VI
24
SubVIs
- A SubVI is a VI that can be used within another
VI - Similar to a subroutine
- Advantages
- Modular
- Easier to debug
- Dont have to recreate code
- Require less memory
25
Icon and Connector
- An icon represents a VI in other block diagrams
- A connector shows available terminals for data
transfer
26
SubVIs
Sub VIs
27
Steps to Create a SubVI
- Create the Icon
- Create the Connector
- Assign Terminals
- Save the VI
- Insert the VI into a Top Level VI
28
Create the Icon
- Right-click on the icon in the block diagram or
front panel
29
Create the Connector
Right click on the icon pane (front panel only)
30
Assign Terminals
31
Save The VI
- Choose an Easy to Remember Location
- Organize by Functionality
- Save Similar VIs into one directory (e.g. Math
Utilities) - Organize by Application
- Save all VIs Used for a Specific Application into
one directory or library file (e.g. Lab 1
Frequency Response) - Library Files (.llbs) combine many VIs into a
single file, ideal for transferring entire
applications across computers
32
Insert the SubVI into a Top Level VI
Accessing user-made subVIs Functions gtgtAll
Functions gtgt Select a VI Or Drag icon onto
target diagram
33
Tips for Working in LabVIEW
- Keystroke Shortcuts
- ltCtrl-Hgt Activate/Deactivate Context Help
Window - ltCtrl-Bgt Remove Broken Wires From Block Diagram
- ltCtrl-Egt Toggle Between Front Panel and Block
Diagram - ltCtrl-Zgt Undo (Also in Edit Menu)
- Tools Options Set Preferences in LabVIEW
- VI Properties Configure VI Appearance,
Documentation, etc.
34
Lets do Exercise 2 now.
35
Section IV Loops and Charts
- For Loop
- While Loop
- Charts
- Multiplots
36
Loops
- While Loops
- Have Iteration Terminal
- Always Run at least Once
- Run According to Conditional Terminal
- For Loops
- Have Iteration Terminal
- Run According to input N of Count Terminal
37
Loops (cont.)
1. Select the loop
2. Enclose code to be repeated
3. Drop or drag additional nodes and then wire
38
Section V Arrays File I/O
- Build arrays manually
- Have LabVIEW build arrays automatically
- Write to a spreadsheet file
- Read from a spreadsheet file
39
Adding an Array to the Front Panel
- From the Controls gtgt All Controls gtgt Array and
Cluster subpalette, select the Array Shell
Drop it on the screen.
40
Adding an Array (cont.)
- Place data object into shell (i.e. Numeric
Control)
41
Creating an Array with a Loop
- Loops accumulate arrays at their boundaries
42
Creating 2D Arrays
43
Section VI Array Functions Graphs
- Basic Array Functions
- Use graphs
- Create multiplots with graphs
44
Array Functions Basics
Functions gtgt All functionsgtgt Array
45
Array Functions Build Array
46
Graphs
- Selected from the Graph palette of Controls menu
- ControlsgtgtAll ControlsgtgtGraphs
Waveform Graph Plot an array of numbers against
their indices Express XY Graph Plot one array
against another Digital Waveform Graph Plot
bits from binary data
47
Do Not Delete This Slide
48
Graphs
Right-Click on the Graph and choose Properties to
Interactively Customize
49
Exercise 5 Using Waveform Graphs
50
Section VII Strings, Clusters, Error Handling
- Strings
- Creating Clusters
- Cluster Functions
- Error I/O
51
Strings
- A string is a sequence of displayable or
nondisplayable characters (ASCII) - Many uses displaying messages, instrument
control, file I/O - String control/indicator is in the Controls Text
Control or Text Indicator
52
Clusters
- Data structure that groups data together
- Data may be of different types
- Analogous to struct in C
- Elements must be either all controls or all
indicators - Thought of as wires bundled into a cable
53
Creating a Cluster
- Select a Cluster shell
- Controls gtgt All Controls gtgt Array Cluster
2. Place objects inside the shell
54
Cluster Functions
- In the Cluster subpalette of the FunctionsgtgtAll
functions palette - Can also be accessed by right-clicking on the
cluster terminal
(Terminal labels reflect data type)
Bundle
Bundle By Name
55
Cluster Functions
Unbundle
Unbundle By Name
Unbundled cluster in the diagram
56
Section VIII - Case Sequence Structures,
Formula Nodes
57
Case Structures
- In the Structures subpalette of Functions palette
- Enclose nodes or drag them inside the structure
- Stacked like a deck of cards, only one case
visible - Functions gtgt Execution control
58
Sequence Structures
- In the Execution Control subpalette of Functions
palette - Executes diagrams sequentially
- Right-click to add new frame
59
Formula Nodes
- In the Structures subpalette
- Implement complicated equations
- Variables created at border
- Variable names are case sensitive
- Each statement must terminate with a semicolon
() - Context Help Window shows available functions
Note semicolon
60
Section X Basic Programming Architecture
- Simple VI Architecture
- General VI Architecture
- State Machine Architecture
61
Simple VI Architecture
- Functional VI that produces results when run
- No start or stop options
- Suitable for lab tests, calculations
- Example Convert C to F.vi
62
General VI Architecture
- Three Main Steps
- Startup
- Main Application
- Shutdown
63
State Machine Architecture
- Advantages
- Can go from any state from any other
- Easy to modify and debug
- Disadvantages
- Can lose events if two occur at the same time
States 0 Startup 1 Idle 2 Event 1 3 Event
2 4 Shutdown
64
Exercise 7 Simple State Machine
65
Do Not Delete This Slide
Recommended
CrystalGraphics Presentations


