
GRAPHING - PowerPoint PPT Presentation
1 / 9
Title:
GRAPHING
Description:
... Crossing of two lines when graphing Graphs: Graphical Way of Presenting Data Bar Graphs: Compares the amount of different characteristics of data. – PowerPoint PPT presentation
Number of Views:173
Avg rating:3.0/5.0
Title: GRAPHING
1
GRAPHING
2
Definitions
- Graph A picture representing a data table.
- X-Axis Horizontal
- Runs across the bottom of the graph.
- Independent Variable
- Y-Axis Vertical
- Runs up and down.
- Dependent Variable
3
Definitions cont
- Data Point Place where the two data lines cross
or intersect (x,y) - Plotting Finding data point for an ordered pair
- Intersection Crossing of two lines when
graphing
4
Graphs Graphical Way of Presenting Data
- Bar Graphs Compares the amount of different
characteristics of data. - Generalizations easily seen
- Line Graphs Shows continuous data using two
data points. - Shows change over time
- Predictions
- Trends
- Pie Charts Uses percentages or fractions to
compare data.
5
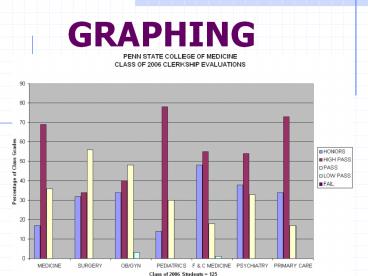
Bar graph
TITLE OF GRAPH
Dependent Variable Y-Axis
Label X and Y axes with name, number and unit (if
available
Independent Variable X-Axis
Legend
6
Line Graph
TITLE OF GRAPH
Label X and Y axes with name, number and unit (if
available
Legend
Dependent Variable Y-Axis
Independent Variable X-Axis
7
Pie graph (Pie Chart)
TITLE OF GRAPH
Label each slice of the pie and write in the
percentage
8
Making A Graph
- Things you must do when making a graph
- Choose the correct graph
- Add an appropriate Title
- Label Axes (X and Y)
- Plot data
- Show Legend
9
(No Transcript)
Recommended
CrystalGraphics Presentations


