
PERCENT OF STUDENTS IN PERFORMANCE LEVELS - PowerPoint PPT Presentation
Title:
PERCENT OF STUDENTS IN PERFORMANCE LEVELS
Description:
... 2004 tests and who were still in NYC schools to take the Grade 4 Math test in May 2005. ... ENGLISH LANGUAGE ARTS. Students in Performance Levels 3 4 ... – PowerPoint PPT presentation
Number of Views:13
Avg rating:3.0/5.0
Title: PERCENT OF STUDENTS IN PERFORMANCE LEVELS
1
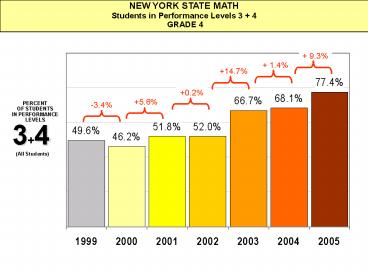
NEW YORK STATE MATH Students in Performance
Levels 3 4 GRADE 4
9.3
1.4
14.7
0.2
5.6
-3.4
PERCENTOF STUDENTS IN PERFORMANCELEVELS
34
(All Students)
2
NEW YORK STATE MATH Students in Performance
Levels 3 4 GRADE 8
8.0
-1.6
PERCENTOF STUDENTS IN PERFORMANCELEVELS
4.6
34
7.0
0.5
-0.5
(All Students)
3
NEW YORK STATE MATH Students in Performance
Levels 3 4 Results by Ethnic/Racial Group Grade
4
in Levels 3 4 in 2005
in Levels 3 4 in 2005
71.4 73.1 90.0 92.3
One-Year Gain
in Levels 3 4 in 2004
in Levels 3 4 in 2004
59.9 62.9 85.0 87.7
4
NEW YORK STATE MATHGRADE 4 Grade 4 Performance
of At-Risk Grade 3 Students Who Were Promoted in
Summer 2004 Compared to All Grade 4 Students in
2004-2005
PERFORMANCELEVEL
4
Lev. 34 53.3 77.4
Lev. 234 96.5 94.6
ADVANCED
3
PROFICIENT
2
BASIC
Meets promotion criterion
1
Does not meet promotion criterion
NOT PROFICIENT
Students Promoted Based on Summer Test(s)N
3,973
ALL GRADE 4 STUDENTSN 74,885
Includes only students scoring in Level 1 on
Spring 2004 grade 3 tests who were promoted based
on Summer 2004 tests and who were still in NYC
schools to take the Grade 4 Math test in May
2005.
5
NEW YORK STATE AND NEW YORK CITY MATH Students
in Performance Levels 3 4GRADES 3 8
6.2
4.8
PERCENTOF STUDENTS IN PERFORMANCELEVELS
4.6
3.3
0.3
0.0
34
Grades 3-8
(All Students)
6
NEW YORK STATE AND NEW YORK CITYENGLISH
LANGUAGE ARTS Students in Performance Levels 3
4GRADES 3 - 8
10.7
0.1
PERCENTOF STUDENTS IN PERFORMANCELEVELS
1.7
0.3
-0.8
4.7
34
Grades 3-8
(All Students)
Grade 7 test scores were not released in 2002
because they appeared inconsistent with other
available information. The 2002 results include
grades 3, 4, 5, 6 and 8 only.
Recommended
CrystalGraphics Presentations


