
Building Level Benchmark Data - PowerPoint PPT Presentation
1 / 19
Title:
Building Level Benchmark Data
Description:
Building Level Benchmark Data. This represents the percent of students who ... The SAT coordinator sets up the meeting with the building principal. ... – PowerPoint PPT presentation
Number of Views:37
Avg rating:3.0/5.0
Title: Building Level Benchmark Data
1
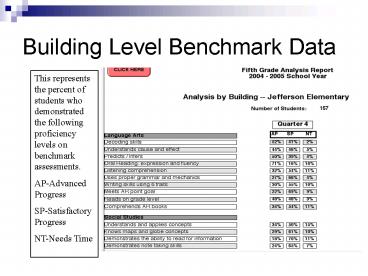
Building Level Benchmark Data
This represents the percent of students who
demonstrated the following proficiency levels on
benchmark assessments. AP-Advanced
Progress SP-Satisfactory Progress NT-Needs Time
2
Disaggregated Benchmark Data
We disaggregate our benchmark data to study how
subgroups are performing.
3
Classroom Benchmark Data
The benchmark data is analyzed by specific
classroom to see how student performance compares
to students across the district.
4
Literacy Day (Supplemental)
- The Literacy Team includes the general education
teachers, special education teachers, Title I
teachers, AEA staff, curriculum director, and
principal. - Quarterly Literacy Day sessions are held to
review existing literacy data for the purpose of
setting up supplemental level interventions to
match student needs. - The following data is reviewed
- K-1 DIBELS, Benchmark Assessments, classroom
data, progress monitoring - 2-5 Fluency/Accuracy, ITBS, Gates-MacGinitie,
Benchmark Assessments, classroom data, progress
monitoring - Make any necessary changes to current student
interventions - Identify students that require more
individualized intensive level interventions.
5
Literacy Day Data
- Numbers in red indicate areas of concerns.
- Numbers in green indicate areas of advanced
skills.
6
Literacy Day Notes
Information was gathered prior to the meeting to
indicate any interventions students were
receiving. During the meeting changes were made
based on current student data.
7
Student Assistance Team (Individual)
- Student Assistance Team
- Teacher makes online referral
- Team includes parents, teachers-core,special
education, and remedial, principal, SAT
coordinator, AEA staff-extended team members for
problem analysis - Team uses data to make decisions regarding
instructional interventions for student - Weekly progress monitoring data is collected and
analyzed to monitor effectiveness of intervention - Follow up SAT meetings are held to review student
progress to make instructional decisions
8
Individual Case Study
- This student enrolled at Pella Community Schools
in August 2004. - Student was identified for Title I assistance
based on previous academic performance and
program placement test. He received instruction
to help increase his fluency and accuracy rates. - SAT referral was made to review interventions and
discuss other concerns. - During Literacy Day data indicated students
accuracy levels were proficient but he needed
continued fluency-building strategies. - He was moved from the Title I program and was
placed into a classroom group intervention for
fluency-building. - Progress monitoring data will continue to be
collected to determine effectiveness of
classroom intervention.
9
SAT Referral Form
The SAT process can be started by any staff
member or parents. Teachers fill out the SAT
referral form online. The SAT coordinator sets up
the meeting with the building principal. Parents
are notified and encouraged to attend.
10
Student Datazone
The teacher will access the datazone to find
student scores on any standardized assessments.
This information is used to make decisions during
the SAT meeting.
11
SAT Meeting Notes
The SAT coordinator records the information from
the meeting and makes it available for review.
12
Progress Monitoring Data
13
Schoolwide Math Model
- Basic computation facts is an area that our ITBS
item analysis has indicated is a weakness of our
district. - Students were selected for an initial screening
based on ITBS scores and benchmark assessments.
These students were also given CBM probes on
mixed math and basic multiplication and division
facts. - Thirty-five third through fifth grade students
were identified as those who were likely to
benefit from participation in the program. - The program was an after-school math intervention
called Math Factory. It was held three days a
week for one hour and ran for ten weeks.
14
Direct Instruction Groups (Supplemental)
Students below the 25th percentile on multiple
areas of the CBM probes were invited to
participate in the program. These students
received instruction using Designing Effective
Mathematics Instruction A Direct Instruction
Approach, Accelerated Math software, and various
math websites. Student progress was measured
using weekly CBM probes. The average gains in
digits correct per week are as follows Third
Grade-1 dc Ambitious goal-.5 dc Fourth Grade-1.9
dc Ambitious goal-1.5 dc Fifth Grade-2.2
dc Ambitious goal-1.2 dc
15
Math Practice Group (Supplemental)
- An additional group of students was targeted to
receive some additional practice on
multiplication and division facts. Students
between the 26-5a0 percentile on the CBM probes
were invited to participate in this group. This
group used a variety of internet resources and
math games and activities to practice fact
fluency and accuracy. The students also received
homework assistance if needed. - Ambitious growth rates range from .5-1.5 digits
correct per week. - The average rate of growth for students on
multiplication facts was 2.3 digits correct per
week. - The average rate of growth for students on
division facts was 1.6 digits correct per week.
16
Take Home Points
- The literature is clear. Schools that are
successful at raising achievement - Clearly define what they want students to know
and be able to do - Align their curriculum and instruction to teach
those things - Keep score
17
Take Home Points
- RtI is not about
- Special Education
- General Education
- Talented and Gifted Education
- Compensatory Education
- RtI is about EVERY EDUCATION
- RtI is fundamentally about improving teaching and
learning/matching differentiated instruction with
student needs
18
Take Home Points
- The biggest advantages of RtI are
- RtI is about taking control of school outcomes
- RtI provides an iterative and recursive system
structure to continuously improve results - RtI provides a system structure for importing
scientific research-based instructional
procedures - RtI allows for customization of implementation at
a school level
19
Quote
- We have witnessed over the last 30 years numerous
attempts at planned educational change. The
benefits have not nearly equaled the costs, and
all too often, the situation has seemed to
worsen. We have, however, gained clearer and
clearer insights over this period about the dos
and donts of bringing about change.One of the
most promising features of this new knowledge
about change is that successful examples of
innovation are based on what might be most
accurately labeled organized common sense.
(Fullan, 1991, p. xi-xii) - Fullan, M. G. (1991). The new meaning of
educational change. New York, NY Teachers
College Press.
Recommended
CrystalGraphics Presentations


