
P1251955652Nxukq - PowerPoint PPT Presentation
1 / 29
Title:
P1251955652Nxukq
Description:
arctic/alpine tundra. grasslands. other non-forested. rivers ... focal predator populations (bear, wolf, coyote, fox) glacier changes, flooding regimes, ... – PowerPoint PPT presentation
Number of Views:32
Avg rating:3.0/5.0
Title: P1251955652Nxukq
1
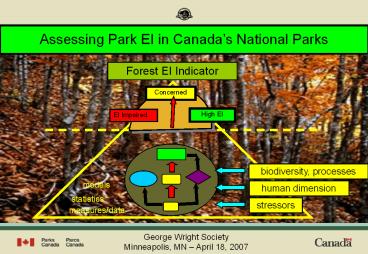
Assessing Park EI in Canadas National Parks
Forest EI Indicator
Concerned
High EI
EI Impaired
biodiversity, processes
models
human dimension
statistics
stressors
measures/data
George Wright Society Minneapolis, MN April 18,
2007
2
ASSESSMENT NEEDS
- CONTEXT why is the assessment being carried
out? - KNOWLEDGE information for the assessments
- METHODS assessment methodologies
- COMMUNICATION displaying results
3
Assessment Context
- enabling legislation Auditor General
- management plan goals and objectives
- management accountability
- for individual management activities
- for the ecological integrity of the protected area
4
PCA Mandate Integration
PROTECT AND PRESENT
5
Park Monitoring and Links with Key Planning and
Reporting Documents
SOPR
Scoping
Management
(5 years)
Document
Plan
(5 years)
(5 years)
EI Monitoring PE Monitoring VE Monitoring
National
SOPHA
Annual
Report
Implementation
(2 years)
Report
6
Management Effectiveness Monitoring
7
State of the Park Report SummaryGros Morne
National Park
8
Assessment Knowledge (1)
- Consensus assessments
- Semi-quantitative assessment based on available
relevant data, structured questions, and
informed opinion - Issues with ecological comprehensiveness,
applicability, repeatability - Affordable, doable and useful
9
(Slide compliments of Steve Giddings NOAA)
10
Assessment Knowledge (2)
- Quantitative, structured monitoring programs
- Assessments based on an ecologically
comprehensive set of monitoring
measures/indicators - Data derived from monitoring projects designed to
address specific monitoring questions, i.e.,
experimental design with appropriate temporal and
spatial scales power/significance - Taken together the data reduce ecological
complexity to a repeatable set of quantitative,
well selected measures that provide a
comprehensive EI assessment - trend analysis - Issues
- Cost, time for meaningful results, flexibility an
issue - rigorous, comprehensive, defensible, repeatable
11
Major Park Ecosystems as EI Indicators
UPLANDS
forests/woodlands arctic/alpine
tundra grasslands other non-forested
WETLANDS
beaches dunes cliffs
riparian, wetlands
COASTAL
estuaries
inter-tidal sub-tidal near-shore pelagic
rivers/streams lakes/ponds
lagoons
FRESHWATER
MARINE
MPEs for Great Lakes Bioregion
12
BIOREGIONAL INDICATORS
The North Pacific Interior Plains Great Lakes Quebec Atlantic Southern Mntns
Forest Forests and woodlands Forest Forest Forest Terrestrial Ecosystems
Tundra Non-forest Grasslands Non-forest Barrens
Wetlands Lakes Wetlands Wetlands Wetlands Aquatic Ecosystems
Freshwater Streams and rivers Lakes Lakes Freshwater Native Biodiversity
Glaciers Islets/shorelines Streams Streams Geology and landscapes
Coastal Inter-tidal Great Lakes Shore Coastal Climate and atmosphere
Marine Sub-tidal Marine support for EI
13
PCA EI MONITORING FRAMEWORK Biodiversity
Structure Processes Stressors
- Local Ecosystems
- suite of measures that monitor most important
structure and process changes at a local
ecosystem scale - Landscapes
- suite of measures that monitor most important
structure and process changes at a landscape
ecosystem scale
- Species Lists
- native species
- alien species
- Focal Species
- mortality/natility
- immigration/emigration
- viability/persistence
- Trophic Structure
- size class distribution
- predation levels
- Inside Park
- most critical in-park stressors
- Outside Park (GPE)
- most critical GPE stressors
- Outside Park
- (Long Distance)
- most critical long distance stressors
14
Ecologically Comprehensive
EI FRAMEWORK
EI INDICATOR
Biodiversity
Processes
Stressors
Forests
Wetlands
lakes
streams
dunes
lagoons
estuaries
v
v
v
v
v
v
v
v
v
v
v
v
v
v
v
v
v
v
v
v
v
15
FOREST EI Indicator
Concerned
EI Impaired
High EI
Public environment
Science environment
feedback
assessment
16
Forest EI Indicator
Concerned
Critical
Healthy
Stand Level Forest EI
Landscape Level Forest EI
Models
ASSESSMENT
tree productivity, songbird index, salamander
populations change, foliar nutrient index,
decomposition efficiency
FF BioD Index (SAR, top predators, ungulates),
CFBioD Index (ecosystem representation),
connectivity, productivity
Measures
dbh, canopy condition, species composition,
chopstick dry weight loss, songbird/salamander
density, relative soil arthropod abundance,
foliar nutrient concentrations
SAR and other species population assessments,
relative ecosystem abundance, Fragstats, AVHRR
Data
17
Capturing EI - Forest Stand Model
18
Capturing EI - Forest Landscape Model
disturbance
19
Forest EI Indicator
Concerned
Critical
Healthy
Stand Level Forest EI
Landscape Level Forest EI
Models
ASSESSMENT
tree productivity, songbird index, salamander
populations change, foliar nutrient index,
decomposition efficiency
FF BioD Index (SAR, top predators, ungulates),
CFBioD Index (ecosystem representation),
connectivity, productivity
Measures
dbh, canopy condition, species composition,
chopstick dry weight loss, songbird/salamander
density, relative soil arthropod abundance,
foliar nutrient concentrations
SAR and other species population assessments,
relative ecosystem abundance, Fragstats, AVHRR
Data
20
Assessment Methodologies
- There is no magic equation to invoke that will
provide the correct answer for the ecological
assessment - Objective to develop a rigorous process that
provides a defensible, repeatable, and
informative ecological assessment - Watchwords - transparency and consultation
- The measures are the thing
- individual monitoring measures are the heart of
the assessment need for defensible
targets/thresholds - Assessment approaches relative to what??
multimetric indices, pre-Columbian state,
biologically-based targets
21
SETTING TARGETS AND THRESHOLDS
22
Forest EI Indicator
Concerned
Critical
Healthy
Stand Level Forest EI
Landscape Level Forest EI
Models
tree productivity, songbird index, salamander
populations change, foliar nutrient index,
decomposition efficiency
FF BioD Index (SAR, top predators, ungulates),
CFBioD Index (ecosystem representation),
connectivity, productivity
Measures
dbh, canopy condition, species composition,
chopstick dry weight loss, songbird/salamander
density, relative soil arthropod abundance,
foliar nutrient concentrations
SAR and other species population assessments,
relative ecosystem abundance, Fragstats, AVHRR
Data
23
FROM MEASURES TO ASSESSMENTS
Can the suite of EI measures make a reliable
statement about the Ecosystem Indicator?
No - If due to missing data for 1 or 2 measures,
can they be fixedwith surrogate data?
Yes - Score measures relative to thresholds
Do 3 or more or 1/3 (whichever comes first) of
the measures have a score of 0?
No - Take average of all scores and rescale from
0 to 100
No Make qualitative assessment
Yes Impaired Red
Score 0 to 33 Impaired Red
Score 34 to 66 Concerned Yellow
Score 67 to 100 Intact Green
24
Measures to Indicators
Simple Roll Up
1
3
5
salamander abundance
0
45
15
30
BIODIVERSITY
forest bird richness
0
22
7.3
14.6
effective patch size
0.2
78.4
26.3
52.6
decomposition
11
89
37
63
regeneration (height class)
PROCESSES
0
13
3
6
productivity (NDVI)
0.1
0.9
0.4
0.7
lichen diversity
14
35
21
28
crown vigor
STRESSORS
0
20
10
5
fragmentation (ENN)
50
250
117
184
25
Measures to Indicators
Simple Roll Up
26
Other Considerations for Assessments
- establish a network of long term sites with a
small suite of co-located and conceptually
inter-related EI measures, e.g., forest/tundra
plots, stream sample sites wetlands, kelp beds - Measure redundancy so ecological effects can be
related - provides some internal logic for assessments
- Potential for measure weighting for assessments
- Locate plots strategically to assess predicted
stressors, - climate change zonal sites or sentinel
sites - Local stressors - land use gradient from highly
impacted to pristine
27
Communicating Assessment Results
- Communication of monitoring assessment critical
component of the assessment process - Wide audiences for assessment results
- Park managers
- Oversight groups (Auditor General)
- Stakeholders and partners, Canadian public
- Science peers
28
ICE (data management)
- EI Assessment
- Guiding Principles
- transparency
- peer review
- consultation
29
Communicating EI Monitoring
Nutrient Cycling
Recommended
CrystalGraphics Presentations


