
Laboratory 1 Measurement of Sound - PowerPoint PPT Presentation
1 / 14
Title:
Laboratory 1 Measurement of Sound
Description:
a. Compare dBA vs dBC. Measurements 14. Exercises. 4. WAVELENGTH EFFECT : ... 5. SHOP SIGNALS : a. Effect of Doubling Numbers of Sources ... – PowerPoint PPT presentation
Number of Views:37
Avg rating:3.0/5.0
Title: Laboratory 1 Measurement of Sound
1
Laboratory 1Measurement of Sound
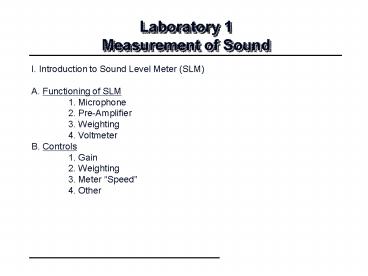
I. Introduction to Sound Level Meter (SLM) A.
Functioning of SLM 1. Microphone 2.
Pre-Amplifier 3. Weighting 4. Voltmeter B.
Controls 1. Gain 2. Weighting 3. Meter
Speed 4. Other
2
Laboratory 1Measurement of Sound
II. Exercises A. SLM 1. Controls 2. Steady
Tone, Tone Burst 3. Wavelength Effect 4.
Weighting Effect B. Shop Signals a. Effect of
Source Doubling (3dB) b. Effect of Distance
Doubling (6dB) c. Direct vs. Reverberant d.
Near vs. Far
3
The Sound Level Meter
Microphone
Weighting
RMS
Pre-Amp
Network
Voltmeter
4
Microphone
From BK
5
The Sound Level Meter
Microphone - Converts sound pressure fluctuations
into proportional voltage fluctuations Pre-Amp
lifier - Conditions the weak voltage signal ?
Boosts so that ordinary voltmeter can measure
it ? Reduces output impedance so that
measurement does not alter the signal
6
The Sound Level Meter
Weighting Network - Modifies signal to correspond
with the appropriate human response to the
signal ? Excludes signals with frequency lt20Hz
or gt 20kHz ? Boosts signals with frequency
500-3000Hz, since the corresponding pressure
fluctuations are more audible ? Nature of
modification depends on the response being
evaluated RMS Voltmeter - Provides a numerical
readout of the weighted signal ? Logarithmic
scale, dB re. 20X10-6N/m2 ? Meter movement
damped to reduce excessive fluctuation, or
averaged to slow down response
7
Frequency Response Characteristics of the A, B, C
and D Weighting Networks
D
A
C
B and C
D
B
A
4
1
2
3
10
10
10
10
Frequency (Hz)
8
dBA
9
Meter Response Controls
FAST - Meter responds quickly to step changes in
continuous sound level. Approximately 0.2 sec
required SLOW - Meter responds slowly to step
changes in continuous sound level.
Approximately 1.0 sec required IMPULSE -
Meter responds to maximum RMS value of
repetitive impulsive sounds PEAK - Meter
responds to maximum peak value of impulsive
sound, even of single responses
10
Controls
1. Gain Control - Sets amplifier. Usually tied to
the meter display 2. Weighting Selector - A, C,
Linear 3. Meter Speed Selector - Controls
meter response Peak 50ms Impulse 35ms Fast
200ms Slow 1000ms
11
Controls
4. Other Controls - added features SEL / LEQ /
SPL / MAX / MIN Sound Incidence - Frontal /
Random Peak - RMS AC Out / DC Out External
Filter In / Out
12
The Microphone in the Sound Field
dB
5
Free - Field Response
0
Pressure Response
- 5
Random Incidence Response
Hz
50 200 1000 5000
13
Exercises
0. CALIBRATION 1. STEADY TONE a. Compare dBA
vs dBC b. Compare dBA(fast) vs dBA(slow) 2.
FLUCTUATING TONE a. Compare dBA vs dBC b.
Compare dBA(fast) vs dBA(slow) 3. RANDOM SIGNAL
a. Compare dBA vs dBC
14
Exercises
4. WAVELENGTH EFFECT a. With Position in
Environment b. With Proximity of Obstacles c.
With Microphone Orientation d. With Position of
Operator 5. SHOP SIGNALS a. Effect of Doubling
Numbers of Sources b. Effect of Doubling
Distance From Source c. Direct vs. Reverberant
Field d. Near vs. Far Field e. Noise Control
Concepts ? Reduce Major Source First ? Reduce
Equivalent Sources Together ? Do Not Overkill the
Major Source
Recommended
CrystalGraphics Presentations


