
Screening Class 4 - PowerPoint PPT Presentation
1 / 95
Title:
Screening Class 4
Description:
Should all women over 40 get a periodic mammogram? Should everyone be screened for TB? ... We can get results to 100% of people who walk in. However, about 8, ... – PowerPoint PPT presentation
Number of Views:36
Avg rating:3.0/5.0
Title: Screening Class 4
1
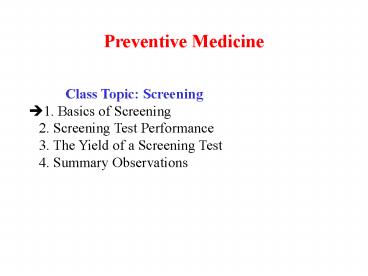
Preventive Medicine Class Topic Screening ?1.
Basics of Screening 2. Screening Test
Performance 3. The Yield of a Screening Test
4. Summary Observations
2
- Some interesting questions
- Should all women over 40 get a periodic
mammogram? - Should everyone be screened for TB? Everyone in
poor communities? - How should we conduct HIV counseling and testing
given non-returners, rapid testing, and social
pressures surrounding an HIV diagnosis?
3
- Should all women be tested for folate deficiency?
- A patient presents with chest pain. Should we
employ a stress test? A catheterization?
4
Screening
- public health screening v. diagnostic testing
- population-based epidemiology v. clinical
epidemiology
5
(No Transcript)
6
(No Transcript)
7
Definition of Screening The examination of
asymptomatic people to classify them as likely or
unlikely to have the disease under
consideration. The people who are likely to
have the disease are investigated further to
determine (as best we can) whether they do or
not. If they do, they are treated more
effectively than they would have been if we had
waited for the disease to become symptomatic.
8
- Properties of a screening test (1)
- feasibility
- acceptance to potential screenees
- cost effectiveness
- yield of cases
- diagnosis and treatment should be available
and meaningful
9
- Properties of a screening test (2)
- reliability (precision)
- validity (accuracy)
- effectiveness
- does it reduce morbidity and/or mortality?
10
(No Transcript)
11
Early diagnosis will always appear to improve
survival, even when therapy is worthless. This
is due to three sources of bias in screening
programs 1. patient selection 2. lead time 2.
length time
12
Three sources of bias in screening programs 1.
patient selection -- volunteer issue Volunteers
are more likely to a) be healthier b) adhere to
treatment protocols
13
Three sources of bias in screening programs 2.
lead time -- the interval between when a case is
detected by a screen and when it would have been
detected clinically is called lead time. Note
that taking lead time into account when
evaluating a screening program is essential
consider the 5-year survival rate after diagnosis
with and without a screening program.
14
(No Transcript)
15
(No Transcript)
16
Three sources of bias in screening programs 3.
length time -- screen detected cases have a
greater probability of having longer preclinical
phases and thus are likely to have better
prognosis.
17
(No Transcript)
18
Understanding these three sources of bias not
only helps us determine if screening programs are
effective but explains a lot about the nature of
screening programs in general. In fact, due to
these potential biases, the effectiveness of any
screening program must be demonstrated by a
rigorous study before it is employed. That is,
we can not simply observe the results of a new
screening process as they may be distorted by
biases such as these.
19
Breast Cancer Screening Program in the Health
Insurance Plan (HIP) of New York,
1963-1975 60,000 women randomized into treatment
and control groups of 30,000 each. 10,000 women
in the treatment group did not participate but
had baseline data collected as well as follow-up
data about breast cancer and mortality. The
treatment group received an initial examination
plus three annual follow-up exams consisting of
clinical breast exam and mammography. The
control group received the usual treatment.
20
Baseline Education of Women in HIP Study
() Group ltHS College Intervention 22.4 31
.0 Participate 19.5 33.7 Not
Participate 28.3 25.8 Control 22.1 32.9
21
Mortality Rates of Women in HIP Study Per 10,000
Women Per Year (After 10 Years) Group All
Causes CVD Intervention 54 24 Participate 42
17 Not Participate 77 38 Control 54 25
22
Intention-To-Treat Model Efficacy v.
Effectiveness An efficacious treatment is one
that is proven better than an alternative for
those who receive it. (works in theory) An
effective treatment is is one that is proven
better than an alternative for those to whom it
is offered. (works in practice)
23
Some results of the HIP randomized trial of early
diagnosis in breast cancer
24
(No Transcript)
25
How Much Harm for How Much Good?
26
(No Transcript)
27
In the HIP Study 20,000 women had to undergo
62,000 examinations to prevent 37 (128-91) women
from dying of breast cancer in 9 years.
28
(No Transcript)
29
This question of harm is a very important one.
Note that when we are screening people in a sense
we are seeking out asymptomatic people. We must
take special care to assure that we have good
reason for screening them and that we do no harm.
Consider a) incorrect diagnoses arising from
screening b) ineffective treatment for the
diagnosed illness c) the impact that a diagnosis
has on people Managing these threats to sound
screening is essential.
30
(No Transcript)
31
Preventive Medicine Class Topic Screening
1. Basics of Screening ?2. Screening Test
Performance 3. The Yield of a Screening Test
4. Summary Observations
32
How well does a screening test do in detecting
the presence/absence of a disease? Is this a good
or bad test? Is this an accurate test?
33
We will always use this set up Disease
Status Present Absent Total Test Pos a
b ab Results Neg
c d cd Total ac
bd abcd (We will not reverse
rows and columns or categories within rows and
columns.)
34
(No Transcript)
35
Disease Status (1) Present Absent
Total Test Pos 10 190
200 Results Neg 20 80
100 Total 30 270 300
36
Disease Status (2) Present Absent
Total Test Pos 10 190
200 (true positives) (false
positives) Results Neg 20 80
100 (false negatives) (true
negatives) Total 30 270
300
37
Disease Status (3) Present Absent
Total Test Pos 10 190
200 Results Neg 20 80
100 Total 30 270 300
prop of pos cases detected as such by a screen
sensitivity a/(ac) 10/30 0.33 prop of neg
cases detected as such by a screen specificity
d/(bd) 80/270 0.30 think about a coin.
38
Disease Status (4) Present Absent
Total Test Pos 20 80
100 Results Neg 10 190
200 Total 30 270
300 a/(ac) 20/30 0.67 sensitivity d/(bd)
190/270 0.70 specificity
39
Disease Status (5) Present Absent
Total Test Pos 30 0
30 Results Neg 0 270
270 Total 30 270
300 a/(ac) 30/30 1.00 sensitivity d/(bd)
270/270 1.00 specificity
40
(No Transcript)
41
Note that sensitivity and specificity are fixed
properties of screening tests. That is, once
they are established they dont vary for
different populations.
42
(No Transcript)
43
(No Transcript)
44
(No Transcript)
45
(No Transcript)
46
(No Transcript)
47
(No Transcript)
48
(No Transcript)
49
(No Transcript)
50
(No Transcript)
51
(No Transcript)
52
(No Transcript)
53
(No Transcript)
54
An Asthma Screen Asthma Present Absen
t Total ED Pos 16 5
21 Visit Neg 15 45
60 Total 31 50 81
sensitivity 16/31 0.52 specificity
45/50 0.90
55
Preventive Medicine Class Topic Screening
1. Basics of Screening 2. Screening Test
Performance ?3. The Yield of a Screening Test
4. Summary Observations
56
(No Transcript)
57
PVP PV the probability that a person has the
disease given that the test is positive PVN
PV- the probability that a person is disease
free given that the test is negative Note that
in clinical practice these are the issues C if a
test comes back positive (or of course negative)
what does the clinician now know? PVP and PVN
help to answer this question.
58
Disease Status (3) Present Absent
Total Test Pos 10 190
200 Results Neg 20 80
100 Total 30 270 300
PVP PV 10/200 5 PVN PV- 80/100
80 think about a coin.
59
Disease Status (4) Present Absent
Total Test Pos 20 80
100 Results Neg 10 190
200 Total 30 270 300 PVP
PV 20/100 20 PVN PV- 190/200 95
60
Disease Status (5) Present Absent
Total Test Pos 30 0
30 Results Neg 0 270
270 Total 30 270 300 PVP
PV 30/30 100 PVN PV- 270/270 100
61
Recall that we saw earlier that sensitivity and
specificity were (once established) fixed
properties of a test. They thus do not depend
upon PVP, PVN or prevalence. PVP and PVN,
however, are not fixed properties and do depend
upon prevalence, sensitivity, and specificity.
62
What is the relationship between PVP, PVN and
prevalence? Consider the question posed by PVP.
It asks given that the test is positive, does
the person have the disease? Clearly this
probability changes with the probability that the
person has the disease (the prevalence). For
example, if the test is positive but the
probability that the person has the disease is
low, we would expect the PVP to be low. If the
probability that the person has the disease is
high we would expect the PVP to be high.
63
Think of prevalence 0 and prevalence
100 (a White person with a test that indicates
sickle cell anemia)
64
What is the relationship between Sensitivity,
Specificity, PVP and PVN? ?The more sensitive a
test, the greater the PVN ?The more specific a
test, the greater the PVP
65
How do the calculations proceed? HIV
Status Present Absent
Total Test Pos Results Neg Total
2,000,000 sensitivity 0.993 specificity
0.995 Can you complete the table and calculate
PV and PV-?
66
How do the calculations proceed? HIV
Status Present Absent
Total Test Pos Results Neg Total
2,000,000 sensitivity 0.993 specificity
0.995 prevalence 2 Now can you complete the
table and calculate PV and PV-?
67
(No Transcript)
68
Note The pre-test probability of a person having
the disease prevalence (ac)/(abcd). The
post-test probability of a person having the
disease PV a/(ab).
69
How do the calculations proceed? HIV
Status Present Absent
Total Test Pos Results Neg Total
2,000,000 sensitivity 0.993 specificity
0.995 prevalence 20 Now can you complete the
table and calculate PV and PV-?
(Homework)
70
(No Transcript)
71
A Real Example A new HIV test is being proposed.
It has been analyzed extensively and has a
sensitivity 0.993 and a specificity 0.995.
What will PVP and PVN be? Note the answer
depends upon the prevalence -- the proportion of
people who are tested who are HIV.
72
Answers Group Seroprev. PVP PVN Child
Bearing Women 0.0015 22 99.999989 STD
Clinics 0.0100 67 99.999929 DOC --
Females 0.0500 91 99.999629 IDUs Entering
Trtmt. 0.1500 97 99.87 Nowhere 0.9000 99.9
94.03
73
(No Transcript)
74
Now, rapid testing is available (with the Single
Use Diagnostic System - SUDS). We can get
results to 100 of people who walk in. However,
about 8,000 will be false positives. What should
we do?
75
(No Transcript)
76
(No Transcript)
77
CDC ADecisions about whether to use rapid tests
should be based on a combination of the
prevalence of HIV in a community and return rates
for test results. In settings of high prevalence
where a low percentage of persons return for
their results (e.g., STD clinics), use of rapid
tests will be most beneficial. In comparison,
rapid tests may be less beneficial in settings of
low prevalence where return can be ensured (e.g.,
most practitioners offices)._at_ (MMWR, March 27,
1998, page 214)
78
(No Transcript)
79
(No Transcript)
80
(No Transcript)
81
(No Transcript)
82
Preventive Medicine Class Topic Screening
1. Basics of Screening 2. Screening Test
Performance 3. The Yield of a Screening
Test ?4. Summary Observations
83
Two questions on screening from the U.S. Medical
Licensing Examination Review Test
84
(No Transcript)
85
(No Transcript)
86
(No Transcript)
87
(No Transcript)
88
Reviewing terms and calculations discussed in
this class, using set-up 2 as an example
89
Disease Status (2) Present Absent
Total Test Pos 10 190
200 Results Neg 20 80
100 Total 30 270 300
90
a/(ac) 10/30true positive ratesensitivity
of those with the disease labeled by the
screen as having the disease a/(ab)10/200pred
ictive value positive (PV or PVP) of those
labeled by the screen as having the disease that
have it
91
b/(ab) 190/200 b/(bd) 190/270 false
positive rate of those without the disease
labeled as having the disease c/(ac) 20/30
false negative rate of those with the disease
labeled as not having the disease c/(cd)
20/100
92
d/(bd)80/270true negative ratespecificity
of those without the disease labeled as not
having the disease d/(cd)80/100predictive
value negative (PV- or PVN) of those labeled
by the screen as not having the disease that
dont have it
93
analogously, b .005 X (abcd - P) Thus,
given the sensitivity, specificity, and
prevalence rate, we can calculate a, b, c, and
d. This then allows the calculation of PVP and
PVN.
94
(No Transcript)
95
Homework for next time A very exciting exercise
on HIV screening, including real life examples.
Give it the time it deserves and you will be
well-rewarded.
Recommended
CrystalGraphics Presentations


