
PowerPointPrsentation - PowerPoint PPT Presentation
1 / 18
Title: PowerPointPrsentation
1
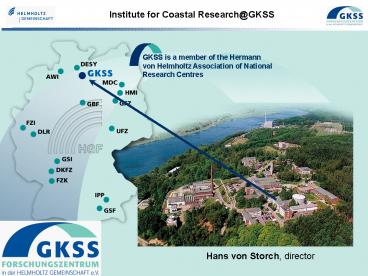
Institute for Coastal Research_at_GKSS
Hans von Storch, director
2
- Institute for Coastal Research
- of GKSS Research Center
- Key research questions addressed by the GKSS
coastal research program are - How is global change affecting the coastal
system? - What is the present state and present change of
the coastal zone? - How can we reliably and cost-effectively monitor
coastal processes?
3
Coasts are
- multi-dimensional environments (geophysical,
ecological, social, economic), the character and
utilization of which are shaped by the
relationship to the sea. - a subsystem of the global Earth System. As such,
a comprehensive view and analysis is only
possible using an Earth System modeling approach. - under the influences of global changes in the
environmental system (climate change) and in the
social system (globalization aestheticization). - key regions for global ecosystems
- significant factors of global cycles of matter
(sources temporary storage)
4
Human Dimension in the Coastal Zones
KSO
5
Institute for Coastal Research_at_GKSS cooperates
with ZMAW (Hamburg) and AWI (Bremerhaven)
Mission
The GKSS Research program advances fundamental
coastal science and provides a scientific basis
for rational coastal management. Our approach
integrates basic research on climate, ecosystem
diversity, and ecological chemistry in the
coastal zone with innovative applied
perspectives, including regional impacts of
Global Change.
Research Topics
Coastal Change long term trends and extreme
events Observation and Information for Coastal
Management Coastal Diversity key species and
food webs Chemical Interactions ecological
functions and effects
6
- Major issues
- Methods for monitoring the quality of the
coastal sea(remote sensing, ferry box, radar
hydrography, ICON, COSYNA) - climate and climate change in coastal regions
(storms, wind, waves, storm surges)
7
- Other issues
- - Remote sensing of coastal bathymetry
- Substances (oil pollution, BaP, nutrients)
- Coastal zone management
- New ecosystem modelling approaches
- Ecological chemistry
- Millennial climate variability modelling
8
Infrastructure of Institute for Coastal Research
- Observational systems
- Stand alone systems wave rider buoys, wave
radar and pole systems - Operational measuring systems on board of ships
(FerryBox) - Measures and systems for remote sensing
- Research vessels Ludwig Prandtl and Storch
- Laboratories equipped with GC-MSD, LC-MS/MS.
GC-MS/MS - DKRZ (German Climate Computing
Centre) - Various environmental system models
- regional atmospheric models CLM and REMO
- hydrodynamic model TRIM
- wave models HYPA-S, k-model, WAM
- atmospheric transport and transformation model
CMAQ - BALTEX Secretariat
- LOICZ - IPO
9
ICON (Integrated Coastal Observation Network)
Construction period 2007 - 2009 Total costs
3.200 T
10
- Reference Points
- deployed at research platforms (FINO 1, 3) and
planned wind energy turbines - use of power supply and telecommunication
- implement a central node to plug in
- common package of sensors (oceanography,
meteorology, FerryBox for water quality
biology) - particle and plankton dynamics
- lander systems to probe water/sediment boundary
- flux measurements of the air/sea boundary
- Transects
- Cross-shore using autonomous underwater vehicles
(AUV, Glider) - Southern North Sea using ships of opportunity
(extended FerryBox) - For specific studies research vessels
Construction period 2009 - 2012 Total costs
9.000 T
11
Issues briefly touched in the following
- Changing Storm climate
- CoastDat retrospective and prospective
decadal simulations of marine weather - North German Climate Office
- BALTEX Assessment for Climate Change in the
Baltic Sea Region
12
Stormcount 1958-2001
Change of Bft 8/year
t T
t T
Weisse et al., J. Climate, 2005
13
Matulla et al., 2007
14
Stockholm Lund
Time series of pressure-based storminess indices
derived from pressure readings in Lund (blue) and
Stockholm (red). From top to bottom Annual
number of pressure observations below 980 hPa
(Np980), annual number of absolute pressure
differences exceeding 16 hPa/12 h
(NDp/Dt), Intra-annual 95-percentile and
99-percentile of the pressure differences (P95
and P99) in units of hPa. From Bärring and von
Storch, 2005 (GRL)
15
Damages and storms
Recent meeting of scientists and re-insurances
(Pielke and Höppe, 2006) Consensus
statement1. Climate change is real, and has
a significant human component related to
greenhouse gases.2. Direct economic losses of
global disasters have increased in recent decades
with particularly large increases since the
1980s.8. Analyses of long-term records of
disaster losses indicate that societal change
and economic development are the principal
factors responsible for the documented
increasing losses to date.
inhomogeneous
16
Regional and local conditions in the recent
past and next century
Simulation with barotropicmodel of North Sea
Globale development(NCEP)
Tide gauge St. Pauli
Dynamical DownscalingREMO or CLM
Cooperation with a variety of governmental
agencies and with a number of private companies
Empirical Downscaling
17
TRIM 3dwater level and barotropic currents
21.02.1993 12 UTC
SN-REMO wind speed and direction 21.02.1993 12
UTC
WAM sig. wave height and direction
21.02.1993 12 UTC
grid size about 5 x 5 km
grid size between about 100 m and 5km
grid size about 50 x 50 km
18
The CoastDat-effort at the Institute for Coastal
Research_at_GKSS
- Long-term, high-resolution reconstuctions (50
years) of present and recent developments of
weather related phenomena in coastal regions as
well as scenarios of future developments (100
years) - Northeast Atlantic and northern Europe
- Standard model systems (frozen)
- Assessment of changes in storms, ocean waves,
storm surges, currents and regional transport of
anthropogenic substances. - Data freely available.
- Applications
- many authorities with responsibilities for
different aspects of the German coasts - economic applications by engineering companies
(off-shore wind potentials and risks) and
shipbuilding company - Public information
www.coastdat.de
19
North German Climate Office_at_GKSS
- An institution set up to enable communication
between science and stakeholders - that is making sure that science understands
the questions and concerns of a variety of
stakeholders - that is making sure that the stakeholders
understand the scientific assessments and their
limits. - Typical stakeholders Coastal defense,
agriculture, off-shore activities (energy),
tourism, water management, fisheries, urban
planning
20
- BACC BALTEX Assessment for Climate Change in
the Baltic Sea Region has been compiled in 2005
to2007 with organizational guidance of the
international BALTEX secretariat at GKSS and
coordinated with the Helsinki Commission HELCOM. - The book has been published in January 2008
- A second review is planned to be published in
2012.
http//www.baltex-research.eu/BACC/Introduction1.h
tml
21
BACC results In short
- Presently a warming is going on in the Baltic Sea
region. - BACC considers it plausible that this warming is
at least partly related to anthropogenic factors. - So far, and in the next few decades, the signal
is limited to temperature and directly related
variables, such as ice conditions. - Later, changes in the water cycle are expected to
become obvious. - This regional warming will have a variety of
effects on terrestrial and marine ecosystems
some predictable such as the changes in the
phenology others so far hardly predictable.
22
Regional DJF precipitation
?0.05
23
Regional JJA temperatures
24
Later tiday, we will summarize our work with
significance, or potential significance, for
Baltic Sea Research in a series of in a series of
presentations, by Emil Stanev development of
pre-operational systems Friedwart Ziemer radar
hydrography Ulrich Callies - transport
dynamics Markus Quante long-range transport of
POPs Heinz Günther ocean waves Eduardo Zorita
long term change
25
Model-Supported Monitoring
- Use numerical modelling to
- (1)optimise the integration of observing
systems. - (2) extend (synthetic) data coverage
- (3) provide consistent information (including
state estimates and forecasts) - (4) improve sampling strategies
ICON (Integrated Coastal Observatory for the
North Sea) COSYNA (Coastal Observation System
for Northern and Arctic Seas) Synergy between
observations and modelling.
26
Current Maps Produced by Horizontally Looking
Radar
vector map grid distance 100 m
Time for acquisition is 20 minutes. Length of
path about 3 nm. Width of stripe about 500 m.
Antenna height about 7 m.
magnitude map grid distance 15 m
direction map grid distance 15 m
27
POPs in the Coastal Marine Environment
Analytical work
Example Sum concentration of polyfluorinated in
the German bight and a part of the Baltic Sea
Chemistry Transport Modelling
Example Deposition of Benzo(a)Pyrene into the
Baltic Sea
sum in 2000 (in tons)
28
Long-range Marine Transport Simulations
- Long-term Lagrangian Transport Simulations in
Support of Monitoring and Risk Analyses - Applications of the data base coastDat
- Tidal basins Exchange rates, travel times
- Biology Observations at Helgoland and marine
transports - Oil I Risk of accidents and their consequences
- Oil II Chronic pollution, monitoring of beached
birds
29
Decadal sea-level variations in the Baltic Sea
DFG Project SINCOS (sinking coasts)
Statistical analysis of sea-level series and
climatic fields indicate that -NAO is important,
but not the only factor. -Other
sea-level-pressure patterns do not explain
sea-level variations either. - Precipitation may
play a larger role in the Southern Baltic,
smaller in the Central and Northern
Baltic. -Relevance for sea-level projections in
21rst century, by applying statistical transfer
functions to IPCC simulations. -Physical
mechanisms unclear analysis of long simulations
with Baltic Sea ocean model
The westerly wind intensity -expressed through
the NAOI) is thought to be the main cause, but
-----gt
Winter (DJF)
65
60
55
50
0
5
10
15
20
25
30
0.0
0.1
0.2
0.3
0.4
0.5
0.6
0.7
Correlation between the North Atlantic
Oscillation index and sea-level, 20th century.
Correlations higher in the North, low in the
South Correlations are unstable in time Other
factors have to be involved
Recommended
CrystalGraphics Presentations


