
A1258586214bXjlC - PowerPoint PPT Presentation
Title:
A1258586214bXjlC
Description:
PERHPP activities are divided into four suites of work focusing on regional ... likely caused by more convective events during Northern Hemisphere summer which ... – PowerPoint PPT presentation
Number of Views:29
Avg rating:3.0/5.0
Title: A1258586214bXjlC
1
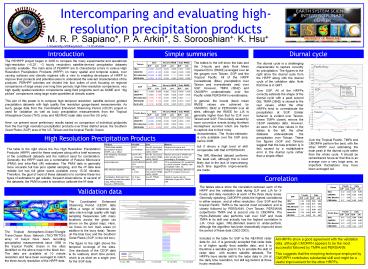
Intercomparing and evaluating high-resolution
precipitation products
M. R. P. Sapiano, P. A. Arkin, S. Sorooshian,
K. Hsu ESSIC, University of Maryland
UC-Irvine
Introduction
Diurnal cycle
Simple summaries
The PEHRPP project began in 2005 to compare the
many experimental and operational high-resolution
(lt0.25, 3 hourly resolution) satellite-derived
precipitation datasets currently available. The
main aims of PEHRPP are to characterize errors in
various High Resolution Precipitation Products
(HRPP) on many spatial and temporal scales, over
varying surfaces and climatic regimes with a view
to enabling developers of HRPP to improve their
products and potential users to understand the
relevant characteristics of the products. PERHPP
activities are divided into four suites of work
focusing on regional comparisons of large areas
over long time periods, high time-resolution
comparisons, very high quality spatial resolution
comparisons using field programs such as NAME and
big picture comparisons using large scale
quantities at climatic scales This aim of this
poster is to compare high temporal resolution,
satellite derived, gridded precipitation datasets
with high quality fine resolution gauge-based
measurements. As such, gauge data from the
Coordinated Enhanced Observing Period (CEOP)
project is used for validation as well as buoy
precipitation measurements from the Tropical
Atmosphere-Ocean (TAO) array and NEXRAD radar
data (over the US only). Here, we present some
preliminary results based on comparison of
individual gridpoints from the four high
resolution precipitation products over three
distinct areas the Southern Great Plains (SGP)
area of the US, Taiwan and the tropical Pacific
Ocean.
The tables to the left show the bias and the
3-hourly and daily Root Mean Squared Error (RMSE)
averaged over all the gauges over Taiwan, SGP and
the Tropical Pacific. All of the HRPP
overestimate (Blue) precipitation over Taiwan and
overestimate (red) over SGP. However, TMPA (3B42)
and CMORPH underestimate over the Pacific whilst
PERSIANN overestimates. In general, the lowest
(best) mean RMSE values are achieved by CMORPH,
3B42 or PERSIANN over all sites, although the
RMSE for JJA is generally higher than that for
DJF over Taiwan and SGP. This is likely caused by
more convective events during Northern Hemisphere
summer which are harder to capture due to their
noisy
The diurnal cycle is a challenging
characteristic to capture correctly for
precipitation. The figures to the right show the
diurnal cycle from the HRPP along with the
diurnal cycle of the validation data. Note that
time is in GMT. Over SGP, All of the HRPPs
correctly estimate the shape of the diurnal cycle
with a peak around 06z. TMPA (3B42) is closest to
the real values, whilst the other HRPPs tend to
overestimate the precipitation at SGP. Similar
behavior is evident over Taiwan, where TMPA
closely mirrors the CEOP validation data.
However, as seen in the bias values in the tables
to the left, the other datasets underestimate the
precipitation over Taiwan. These two figures (SGP
and Taiwan) suggest that the bias problem is in
fact caused by a multiplicative error in the
diurnal cycle rather than a simple offset.
Taiwan Bias Bias 3Hourly RMSE 3Hourly RMSE Daily RMSE Daily RMSE
Taiwan DJF JJA DJF JJA DJF JJA
3B42 -0.058 -0.017 0.024 0.058 0.031 0.067
CMORPH -0.074 -0.143 0.020 0.043 0.028 0.063
NRL-Blended -0.044 -0.160 0.024 0.112 0.033 0.091
PERSIANN -0.054 -0.131 0.019 0.043 0.030 0.062
Pacific Buoy
SGP Bias Bias 3Hourly RMSE 3Hourly RMSE Daily RMSE Daily RMSE
SGP DJF JJA DJF JJA DJF JJA
3B42 0.006 0.004 0.008 0.022 0.009 0.028
CMORPH 0.003 0.138 0.006 0.028 0.007 0.038
NRL-Blended 0.030 0.150 0.018 0.065 0.027 0.120
PERSIANN 0.027 0.124 0.007 0.027 0.010 0.037
Hydro-Est 0.016 0.019 0.010 0.023 0.013 0.030
SGP
Taiwan
Pacific Buoy Bias Bias 3Hourly RMSE 3Hourly RMSE Daily RMSE Daily RMSE
Pacific Buoy DJF JJA DJF JJA DJF JJA
3B42 -0.023 -0.010 0.013 0.019 0.015 0.022
CMORPH -0.030 -0.009 0.018 0.025 0.023 0.031
NRL-Blended -0.009 0.001 0.030 0.052 0.044 0.102
PERSIANN 0.011 0.026 0.017 0.018 0.025 0.024
characteristics. The Hydro-estimator is only
available over the SGP area before 2006, but it
shows a high level of skill comparable with that
of PERSIANN The NRL-Blended dataset performs the
least well, although this is most likely due to
the lack of reprocessing each time algorithm
improvements are made
High Resolution Precipitation Products
Over the Tropical Pacific, TMPA and CMORPH
perform the best, with the other HRPP over
estimating the main peak in the diurnal cycle
rather than the whole cycle. It should be
remembered however that this is an average over a
very large area, so important fluctuations may
have been averaged out.
Product Provider Data Method
TRMM Multi-satellite precipitation analysis (TMPA, a.k.a. 3B42) GSFC (G. Huffman) Geo-IR, microwave from SSM/I, TRMM, AMSU, AMSR Merged microwave and microwave-calibrated infrared (IR)
CPC Morphing Technique (CMORPH) NOAA CPC (J. Janowiak, B. Joyce) Geo-IR, microwave from SSM/I, TRMM, AMSU, AMSR Passive microwave (PMW) rain rates advected and evolved according to IR imagery
Hydro-Estimator NOAA NESDIS ORA (B. Kuligowski) Geo-IR, NWP Tb in geostationary-IR, modulated by cloud evolution, stability, total precipitable water, etc.
NRL blended algorithm NRL (J. Turk) Geo-IR, microwave from SSM/I, TRMM, AMSU, AMSR Histogram-matching calibration of geo-IR to merged microwave
Precipitation Estimation from Remotely Sensed Information using Artificial Neural Networks (PERSIANN) UC Irvine (K.-L. Hsu) Geo-IR, TRMM microwave Adaptive neural network calibration of geo-IR to TRMM TMI
The table to the right shows the five High
Resolution Precipitation Products (HRPP) used for
these analyses along with a brief summary of the
constituent datasets and the method used for
combination. Generally, the HRPP used are a
combination of Passive Microwave (PMW) and
Infra-Red (IR) estimates The PMW data is
generally more accurate but has poor spatial
sampling, and the IR data less reliable but has
full globe scans available every 15-30 minutes.
Therefore, the goal of most of these datasets is
to combine these two types of estimates to get
reliable, frequent observations. In several of
the datasets, the PMW is used to somehow
calibrate the IR data.
Correlation
Taiwan 3 hourly 3 hourly Daily Daily
Taiwan DJF JJA DJF JJA
3B42 0.32 0.40 0.49 0.59
CMORPH 0.43 0.45 0.55 0.59
NRL-Blended 0.17 0.44 0.22 0.42
PERSIANN 0.37 0.44 0.52 0.59
The tables above show the correlation between
each of the HRPP and the validation data during
DJF and JJA for 3-hourly and daily resolution at
each of the three study areas. Generally
speaking, CMORPH yields the highest correlations
in either season and at either resolution. Over
SGP and the tropical Pacific, TMPA is the second
most correlated, and is closely followed by
PERSIANN. Over Taiwan, PERSIANN outperforms TMPA
and is second only to CMORPH. The Hydro-Estimator
also performs well over SGP and rivals TMPA in
its skill and actually has the highest
correlation in JJA. Once again, NRL-Blended seems
to under-perform, although the algorithm has been
dramatically improved since the period of these
data (2002-2003).
Validation data
SGP 3 hourly 3 hourly Daily Daily
SGP DJF JJA DJF JJA
3B42 0.44 0.54 0.66 0.62
CMORPH 0.58 0.55 0.71 0.62
NRL-Blended 0.11 0.40 0.14 0.45
PERSIANN 0.37 0.47 0.56 0.57
Hydro-Est 0.39 0.54 0.69 0.67
NEXRAD NA 0.62 NA 0.67
The Coordinated Enhanced Observing Period (CEOP)
data offers a range of reference site data which
is high quality with high sampling frequencies
with many locations across the globe (as shown on
the global map). Here, we focus on two main areas
(in addition to the buoy data) Taiwan (in the
blue box) and the Southern Great Plains (SGP in
the red box). The figure to the right shows the
temporal coverage of the sites. One drawback of
the CEOP data is its relatively short time
period, which is as short as a single year for
the SGP data.
Pacific Buoy 3 hourly 3 hourly Daily Daily
Pacific Buoy DJF JJA DJF JJA
3B42 0.41 0.31 0.60 0.48
CMORPH 0.37 0.35 0.57 0.50
NRL-Blended 0.23 0.22 0.38 0.28
PERSIANN 0.30 0.26 0.44 0.38
The Tropical Atmosphere-Ocean/Triangle
Trans-Ocean Buoy Network (TAO/TRITON) array of
buoys have been recording precipitation
measurements since 1998 in the tropical Pacific
Ocean in the sites identified on the above map in
the black box. The data are available at 10
minute resolution and have been averaged to match
the three-hourly resolution of the HRPP data.
Included in the table for SGP is the NEXRAD radar
data for JJA. It is generally accepted that radar
data is of higher quality than satellite data,
and it is therefore a sensible goal to try to
emulate the skill of radar data with modern
satellite datasets. The HRPPs have similar skill
to the radar data in JJA at the daily time
resolution, but still lag behind at three hourly
resolution.
All HRPPs show a good agreement with the
validation data, although CMORPH appears to be
the most successful followed by TMPA and
PERSIANN. This suggests that the morphing
technique employed by CMORPH contributes
substantial skill and might be a useful
improvement for the other HRPPs.
Recommended
CrystalGraphics Presentations


