
LAGR Phase I Accomplishments - PowerPoint PPT Presentation
1 / 2
Title: LAGR Phase I Accomplishments
1
LAGR Phase I Accomplishments
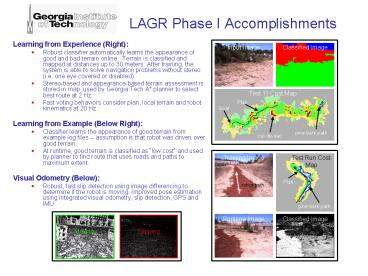
- Learning from Experience (Right)
- Robust classifier automatically learns the
appearance of good and bad terrain online.
Terrain is classified and mapped at distances up
to 30 meters. After training, the system is able
to solve navigation problems without stereo (i.e.
one eye covered or disabled). - Stereo-based and appearance-based terrain
assessment is stored in map, used by Georgia Tech
A planner to select best route at 2 Hz. - Fast voting behaviors consider plan, local
terrain and robot kinematics at 20 Hz. - Learning from Example (Below Right)
- Classifier learns the appearance of good terrain
from example log files -- assumption is that
robot was driven over good terrain. - At runtime, good terrain is classified as low
cost and used by planner to find route that uses
roads and paths to maximum extent. - Visual Odometry (Below)
- Robust, fast slip detection using image
differencing to determine if the robot is moving.
Improved pose estimation using integrated visual
odometry, slip detection, GPS and IMU.
Input Image
Classified Image
Test 11 Cost Map
Plan
Goal
pine bark path
cul-de-sac
Test Run Cost Map
Training Image
Plan
robot path
pine bark path
Runtime Image
Classified Image
Moving
Slipping
2
LAGR Phase II Research Plan
- Scene Analysis using Segmentation and Adjacency
(Right) - Observation Neighboring regions in an image are
likely to have similar properties (e.g.
traversability). - Approach Use adjacency information in
combination with learned appearance model to
classify segmented image regions. Initial results
shown on right. - Research questions 1) Which features (e.g.
color, texture) are best? 2) How can we improve
computational efficiency? - Learning from Ex. Image/Action Association
(Below Right) - Objective Go beyond terrain classification
learn what to do Stay between the white
lines - Keep to the right of yellow lines
- Stop when you see a red octagon
- Approach Associate image/action pairs in
training log files. At runtime, find best image
match, and use corresponding action as advice.
Quality of match is used to assess quality of
advice. Initial results shown below right. - Research questions 1) Is simple image matching
the best way to index advice? Should we use
derivative images (e.g. edges, colors)? 2) What
are the best methods for keeping size of data
base small, but fast and accurate? - SFM-SLAM Structure From Motion for Smart
Localization and Mapping (Below) - Objective Reduce pose estimate error due to poor
GPS, improve mapping and map registration. - Approach SFM
Runtime Image
Segmentation
Adjacency Graph
Classified Image
Runtime Image
Best Match Action
3D map computed from Test 11 log file. Green
points are ground plane, yellow points are trees.
Recommended
CrystalGraphics Presentations


