
Logistic Regression - PowerPoint PPT Presentation
1 / 6
Title:
Logistic Regression
Description:
1) assessment (outcome: 0=fail, 1=pass) 2) adjust - social ... On-line reading: Chao-Ying and Tak-Shing (2002) Graduate Statistics Workshop 4. 2. Logistic ... – PowerPoint PPT presentation
Number of Views:27
Avg rating:3.0/5.0
Title: Logistic Regression
1
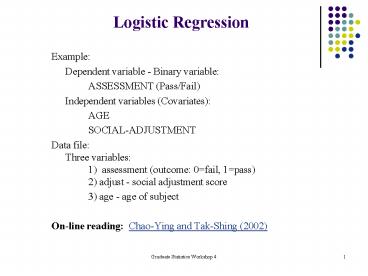
Logistic Regression
- Example
- Dependent variable - Binary variable
- ASSESSMENT (Pass/Fail)
- Independent variables (Covariates)
- AGE
- SOCIAL-ADJUSTMENT
- Data fileThree variables 1) assessment
(outcome 0fail, 1pass) 2) adjust - social
adjustment score - 3) age - age of subject
- On-line reading Chao-Ying and Tak-Shing (2002)
2
Logistic
Linear regression OUTCOME AGE
ADJUST Logistic transformation (logit) logit
log(probpass/probfail) logit
log(odds) Logistic regression (logit
analysis) log(odds) b0 b1AGE
b2ADJUST odds eb0 b1AGE b2ADJUST
3
Logistic Models
logit ß0 MODEL0 logit ß0
ß1age MODEL1 logit ß0 ß1age
ß2adjust MODEL2 GOODNESS OF FIT -2
LL improvement MODEL0 61.105
MODEL1 47.389 13.72 (1df) MODEL2 25.265 22.1
2 (1df)
4
Beta coefficients
Beta coefficients Variable B Wald df Sig AGE
-0.2349 2.9538 1 0.0857 ADJUST 0.5521 11.7930
1 0.0006 Constant 1.9612 0.0578 1 0.8099
5
Probability Estimates
odds probpass/probfail probfail 1 -
probpass odds probpass/(1-probsuccess) odd
s eb0 b1age b2adjust probpass 1 /
(1e-b0 b1age b2adjust) Odds and
probability re. assessment experiment odds
e1.9612-(0.2349AGE)(0.5521ADJUST) prob(pass)1/(
1 e-1.9612-(0.2349AGE)(0.5521ADJUST))
6
Categorical Explanatory Variablese.g Female 0,
Male 1
log(odds) b0 b1AGE b2ADJUST b3Female
b4Male SPSS internal re-coding of data (dummy
variables) Female 0 or 1 Male 0 1 (
Not necessary with binary categorical variables)
Recommended
CrystalGraphics Presentations


