ANOVA and linear regression July 15, 2004 - PowerPoint PPT Presentation
Title:
ANOVA and linear regression July 15, 2004
Description:
ANOVA and linear regression July 15, 2004 – PowerPoint PPT presentation
Number of Views:161
Avg rating:3.0/5.0
Title: ANOVA and linear regression July 15, 2004
1
ANOVA and linear regressionJuly 15, 2004
2
ANOVAfor comparing means between more than 2
groups
3
ANOVA (ANalysis Of VAriance)
- Idea For two or more groups, test difference
between means, for quantitative normally
distributed variables. - Just an extension of the t-test (an ANOVA with
only two groups is mathematically equivalent to a
t-test). - Like the t-test, ANOVA is parametric
testassumes that the outcome variable is roughly
normally distributed with a mean and standard
deviation (parameters) that we can estimate
4
ANOVA Assumptions
- Assumptions Normally distributed outcome
variable homogeneity of variances (like t-test)
5
The F-test
Is the difference in the means of the groups more
than background noise (variability within
groups)?
6
Spine bone density vs. menstrual regularity
1.2
1.1
1.0
S
P
I
N
E
0.9
0.8
0.7
amenorrheic
oligomenorrheic
eumenorrheic
7
Group means and standard deviations
- Amenorrheic group (n11)
- Mean spine BMD .92 g/cm2
- standard deviation .10 g/cm2
- Oligomenorrheic group (n11)
- Mean spine BMD .94 g/cm2
- standard deviation .08 g/cm2
- Eumenrroheic group (n11)
- Mean spine BMD 1.06 g/cm2
- standard deviation .11 g/cm2
8
The F-Test
9
The F-distribution
- The F-distribution is a continuous probability
distribution that depends on two parameters n and
m (numerator and denominator degrees of freedom,
respectively)
10
The F-distribution
- A ratio of sample variances follows an
F-distribution
- The F-test tests the hypothesis that two sample
variances are equal. - F will be close to 1 if sample variances are
equal.
11
ANOVA Table
TSSSSB SSW
12
ANOVAt-test
13
ANOVA summary
- A statistically significant ANOVA (F-test) only
tells you that at least two of the groups differ,
but not which ones differ. - Determining which groups differ (when its
unclear) requires more sophisticated analyses to
correct for the problem of multiple comparisons
14
Question Why not just do 3 pairwise ttests?
- Answer because, at an error rate of 5 each
test, this means you have an overall chance of up
to 1-(.95)3 14 of making a type-I error (if all
3 comparisons were independent) - If you wanted to compare 6 groups, youd have to
do 6C2 15 pairwise ttests which would give you
a high chance of finding something significant
just by chance (if all tests were independent
with a type-I error rate of 5 each) probability
of at least one type-I error 1-(.95)1554.
15
Multiple comparisons
With 18 independent comparisons, we have 60
chance of at least 1 false positive.
16
Multiple comparisons
With 18 independent comparisons, we expect about
1 false positive.
17
Correction for multiple comparisons
- How to correct for multiple comparisons post-hoc
- Bonferronis correction (adjusts p by most
conservative amount assuming all tests
independent, divide p by the number of tests) - Holm/Hochberg (gives p-cutoff beyond which
not significant) - Tukeys (adjusts p)
- Scheffes (adjusts p)
18
Non-parametric ANOVA
- Kruskal-Wallis one-way ANOVA
- Extension of the Wilcoxon Rank-Sum test for 2
groups based on ranks - Proc NPAR1WAY in SAS
19
Linear regression
20
Outline
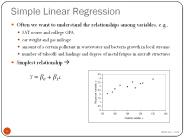
- 1. Simple linear regression and prediction
- 2. Multiple linear regression and multivariate
analysis - 3. Dummy coding categorical predictors
21
Review what is Linear?
- Remember this
- YmXB?
22
Review whats slope?
A slope of 2 means that every 1-unit change in X
yields a 2-unit change in Y.
23
Example
- Whats the relationship between gestation time
and birth-weight?
24
Birth-weight depends on gestation time
(hypothetical data)
Ybirth- weight (g)
Xgestation time (weeks)
25
Linear regression equation
- Birth-weight (g) ? ?(X weeks) random
variation - Birth-weight (g) 0 100(X wks)
26
Prediction
- If you know something about X, this knowledge
helps you predict something about Y.
27
Prediction
- Baby weights at Stanford are normally distributed
with a mean value of 3400 grams. - Your Best guess at a random babys weight,
given no information about the baby, is what? - 3400 grams
- But, what if you have relevant information? Can
you make a better guess?
28
Prediction
- A new baby is born that had gestated for just 30
weeks. Whats your best guess at the
birth-weight? - Are you still best off guessing 3400?
- NO!
29
At 30 weeks
Ybirth- weight (g)
3000
Xgestation time (weeks)
30
30
At 30 weeks
Ybirth weight (g)
3000
Xgestation time (weeks)
30
31
At 30 weeks
- The babies that gestate for 30 weeks appear to
center around a weight of 3000 grams. - Our linear regression equation predicts that a
baby of 30 weeks gestation will weigh 3000g - Expected weight (g) 100(30 weeks)
32
And, if X20, 30, or 40
Ybirth- weight (g)
Xgestation time (weeks)
20
30
40
33
If X20, 30, or 40
Ybaby weights (g)
Xgestation times (weeks)
20
30
40
34
Mean values fall on the line
- At 40 weeks, expected weight 4000
- At 30 weeks, expected weight 3000
- At 20 weeks, expected weight 2000
- In general,
- Expected weight 100 grams/weekX wks
35
Assumptions (or the fine print)
- Linear regression assumes that
- 1. The relationship between X and Y is linear
- 2. Y is distributed normally at each value of X
- 3. The variance of Y at every value of X is the
same (homogeneity of variances)
36
Non-homogenous variance
Ybirth-weight (100g)
Xgestation time (weeks)
37
A ttest is linear regression!
- A t-test is an example of linear regression with
a binary predictor. - For example, if the mean difference in spine bone
density between a sample of men and a sample of
women is .11 g/cm2 and the women have an average
value of .99, then the t-test for the difference
in the means is mathematically equivalent to the
linear regression model - Spine BMD (g/cm2) .99 (intercept) .11 (1 if
male)
38
Multiple Linear Regression
- More than one predictor
- ? ? ?1X ?2 W ?3 Z
- Each regression coefficient is the amount of
change in the outcome variable that would be
expected per one-unit change of the predictor, if
all other variables in the model were held
constant.
39
ANOVA is linear regression!
- A categorical variable with more than two groups
- E.g. groups 1, 2, and 3 (mutually exclusive)
- ? ? (value for group 1) ?1(1 if in group 2)
?2 (1 if in group 3) - This is called dummy codingwhere multiple
binary variables are created to represent being
in each category (or not) of a categorical
variable
40
Example ANOVA linear regression
- In SAS
- data stats210.runners
- set stats210.runners
- if mencat1 then amenorrheic1 else
amenorrheic0 - if mencat2 then oligomenorrheic1 else
oligomenorrheic 0 - run
- The good news is that SAS will often do this for
you with a class statement!
41
Functions of multivariate analysis
- Control for confounders
- Test for interactions between predictors (effect
modification) - Improve predictions
42
Multiple linear regression caveats
- Multicollinearity arises when two variables that
measure the same thing or similar things (e.g.,
weight and BMI) are both included in a multiple
regression model they will, in effect, cancel
each other out and generally destroy your model.
- Model building and diagnostics are tricky
business!
43
Other types of multivariate regression
- Multiple linear regression is for normally
distributed outcomes - Logistic regression is for binary outcomes
- Cox proportional hazards regression is used when
time-to-event is the outcome
44
Reading for this week
- Chapters 6-8, 10
45
Note Midterm next week
- One cheat sheet allowed for in-class portion
and one for in-lab portion
Recommended
CrystalGraphics Presentations