
Towards Personalized Radiation Therapy: Translation of - PowerPoint PPT Presentation
1 / 1
Title:
Towards Personalized Radiation Therapy: Translation of
Description:
Network to the Prediction of Clinical Radiation Response ... 10 gene (hub) model (NF-KB, HDAC1, SUMO-1, C-Jun, PKC, c-ABL, IRF-1, STAT1, ... – PowerPoint PPT presentation
Number of Views:61
Avg rating:3.0/5.0
Title: Towards Personalized Radiation Therapy: Translation of
1
Towards Personalized Radiation Therapy
Translation of a Mathematical Model of the
Radiation Sensitivity Network to the Prediction
of Clinical Radiation Response
Steven Eschrich, Hongling Zhang, Haiyan Zhao,
Ji-Hyun Lee, Gregory Bloom, David Boulware, Caio
Rocha-Lima, Douglas P. Calvin, Timothy J.
Yeatman and Javier F. Torres-Roca Dept. of
Interdisciplinary Oncology, H. Lee Moffitt Cancer
Center Research Institute and University of
South Florida, Tampa, FL
Algorithm and Biological Validation
Background/Purpose
Understanding the biological networks that
regulate tumor radiosensitivity is central to the
development of personalized medicine in radiation
oncology. Therefore, we sought to develop a
systems model of the radiosensitivity network.
Methods
The mathematical model is represented by the
following equation SF2 k0 k1(yx) k2(TO)
k3(ras status) k4(p53 status) k5(yx)(TO)
k6(yx)(ras status) k7(TO)(ras status)
k8(yx)(p53 status) k9 (TO)(p53) k10 (ras
status)(p53 status) k11(yx)(TO)(ras status)
k12(yx)(ras status)(p53 status) k13(TO)(ras
status)(p53status) k14 (yx)(TO)(ras status)(p53
status) where y represents GE and kx are
constants determined by fitting the model. We
evaluated the model by determining the linear fit
of the predicted and measured SF2 curve. Analysis
of Variance (ANOVA) is used to determine the
significant terms, or dynamic interactions within
the model.
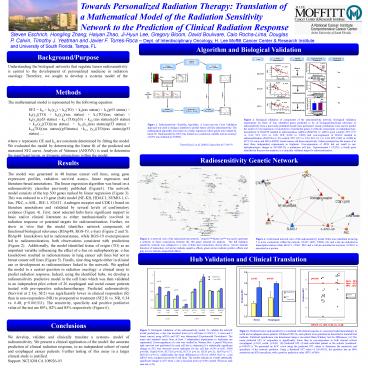
Figure 2. Biological validation of components of
the radiosensitivity network. Biological
validation experiments for three of four
identified genes predicted to be of
biological/functional relevance in
radiosensitivity from a previously published
model were performed. Linear correlations were
used to predict the result of over-expression or
knockdown of predicted genes or network
components on radiophenotype. Knockdown of RBAP48
resulted in radioresistance (siRNA (RBAP48) vs.
siRNA (pool control) SF2 0.37 vs. 0.26, SF4
0.10 vs. 0.06, SF8 0.006 vs. 0.003) and
over-expression of RGS19 resulted in
radiosensitization (RGS19-hi vs. EV-control SF2
0.35 vs. 0.50, SF4 0.11 vs. 0.18, SF8 0.002 vs.
0.008) in HCT-116 colon and MDA-MB231 breast
cancer cell lines respectively. Values presented
are the means of at least three independent
experiments in triplicate. Over-expression of
RPIA did not result in any radiophenotypic change
in SK-MEL28, a melanoma cell line. Topoisomerase
I (TOP1), a fourth gene identified in the
previous analysis, is a clinically validated
target for radiosensitization.
Figure 1. Radiosensitivity Classifier Algorithm.
A Leave-one-out Cross Validation approach was
used to design a classifier to predict tumor cell
line radiosensitivity. The mathematical algorithm
was based on a linear regression where genes were
ranked by linear fit. Radiosensitivity (SF2) was
treated as a continuous variable and an accuracy
of 62 was obtained (p0.0002).
Torres-Roca J, et al. (2005) Cancer Res
657169-76
Radiosensitivity Genetic Network
Results
The model was generated in 48 human cancer cell
lines, using gene expression profiles, radiation
survival assays, linear regression and
literature-based annotations. The linear
regression algorithm was based on a
radiosensitivity classifier previously published
(Figure1). The network model consists of the top
500 genes ranked by linear regression (Figure 3).
This was reduced to a 10 gene (hub) model (NF-KB,
HDAC1, SUMO-1, C-Jun, PKC, c-ABL, IRF-1, STAT1,
Androgen receptor and CDK1) based on literature
annotations and validated by several levels of
confirmatory evidence (Figure 4). First, most
selected hubs have significant support in basic
and/or clinical literature as either
mechanistically involved in radiation response or
potential targets for radiosensitization.
Further, we show in vitro that the model
identifies network components of
functional/biological relevance (RbAp48, RGS-19,
c-Jun) (Figure 2 and 5). RbAp48 knockdown led to
radioresistance, while RGS-19 overexpression led
to radiosensitization, both observations
consistent with predictions (Figure 2).
Additionally, the model identified tissue of
origin (TO) as an important variable influencing
the effect of c-Jun on radiophenotype c-Jun
knockdown resulted in radioresistance in lung
cancer cell lines but not in breast cancer cell
lines (Figure 5). Finally, nine drug targets
either in clinical use or development as
radiosensitizers linked to the network. We
applied the model to a central question in
radiation oncology a clinical assay to predict
radiation response. Indeed, using the identified
hubs, we develop a radiosensitivity predictive
model in the cell lines which was then validated
in an independent pilot cohort of 26 esophageal
and rectal cancer patients treated with
pre-operative radiochemotherapy. Predicted
radiosensitivity (Survival at 2 Gy, SF2) was
significantly lower in clinical responders (R)
than in non-responders (NR) to preoperative
treatment (SF2 R vs. NR, 0.34 vs. 0.48,
p0.001511). The sensitivity, specificity and
positive predictive value of the test are 80,
82 and 85 respectively (Figure 6).
Figure 3. A network view of the radiosensitivity
network. GeneGO MetaCore was used to generate
a network of direct connections between the 500
genes selected for analysis. The full radiation
sensitivity network was collapsed to a view of
hubs and connections, shown above. Arrows
indicate direction of interaction red arrows
indicate negative effects, green arrows indicate
positive effects and gray arrows indicate
unspecified effects.
Figure 4. A hub-based network view of the
radiosensitivity model. Hubs were identified as
having 5 or more connections within the network.
STAT1, IRF1, NFKB, AR, and c-Jun are indicated as
transcription factors while HDAC1, CDK1, PKC and
c-Abl are annotated as enzymes. SUMO1 is
annotated as a protein.
Hub Validation and Clinical Translation
p-0.03
p0.05
p0.002
Sens 80 Spec 82 PPV 85
p0.06
p0.004
p0.04
p0.02
Conclusions
SF2 R vs. NR, 0.34 vs. 0.48
Figure 5. Biological validation of the
radiosensitivity model. To validate the network
model predictions, c-Jun was knocked down in 8
cell lines (3 NSCLC, 3 colon and 2 breast cancer)
using siRNA and SF2 was determined (Experimental
Procedures). The mean and standard errors from at
least 5 independent experiments in triplicates
are represented. Down-regulation of c-Jun was
verified by Western blot. A paired Wilcoxon rank
sum test was performed for each cell line to
determine if a statistically significant change
in SF2 was observed across replicates for the
cell line (A549 p0.06 H460 p0.004 Hop620.04
HCT116 p0.02 HCT15 p0.16 HT29 p0.31 Hs578
p0.77 MDA231 p0.16). Additionally, the mean
differences in SF2 for siRNA Pool vs. c-Jun siRNA
were compared across the 8 cell lines. The
results indicate an overall statistically
significant change in SF2 when c-Jun is knocked
down (p0.016 paired Wilcoxon rank sum test,
n8).
Figure 6. Predicted tumor radiosensitivity is
correlated with clinical response to concurrent
radiochemotherapy in rectal and esophageal cancer
patients. Predicted SF2s for each patient were
generated as described in material and methods.
Statistical significance was determined using a
one-sided Mann-Whitney test for differences. (A)
The mean predicted SF2 of responders is
significantly lower than in non-responders in
both clinical cohorts (esophageal p0.05,
rectal p0.03). (B) Predicted SF2 of each
individual patient in the cohorts (combined
p0.001511). We generated an ROC curve using the
predicted SF2 values to determine the sensitivity
and specificity of the network predictor. Using a
threshold SF2 value of 0.4619592, the predictor
has an 80 sensitivity and 82 specificity, with
a positive predictive value (PPV) of 86.
We develop, validate and clinically translate a
systems- model of radiosensitivity. We present a
clinical application of the model the accurate
prediction of clinical radiation response, in an
independent cohort of rectal and esophageal
cancer patients. Further testing of this assay in
a larger clinical study is justified. Support
NCI K08 CA 108926-03
Recommended
CrystalGraphics Presentations


