
Goal and scope definition - PowerPoint PPT Presentation
1 / 18
Title:
Goal and scope definition
Description:
Selection of impact categories, category indicators and characterization models ... Methyl Bromide 0.37. Source: (Guin e et al., 2002) Impact Assessment ... – PowerPoint PPT presentation
Number of Views:36
Avg rating:3.0/5.0
Title: Goal and scope definition
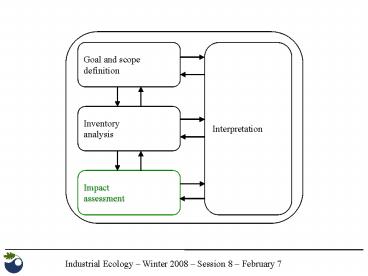
1
Goal and scopedefinition
Interpretation
Inventoryanalysis
Impactassessment
2
Elements of LCIA according to ISO 14044
Mandatory elements
Selection of impact categories, category
indicators and characterization models
Classification Assignment of LCI results to
impact categories
Characterization Calculation of category
indicator results
Category indicator results (LCIA profile)
Optional elements Normalization Grouping Weighti
ng Data quality analysis
3
Impact AssessmentClassification and
characterization
Example
In general
LCI results
Cd, CO2, NOX, SO2, etc. (kg/functional unit)
Impact category
Acidification
LCI results assigned to Impact category
NOX, SO2, etc. (kg/functional unit)
Characterization model
Category indicator results
Proton release (H aq)
- Forest
- Vegetation
- etc.
Category endpoint(s)
Source ISO14044
4
Impact AssessmentClassification and
characterization Example 1
Impact category Climate change LCI
results Emissions of greenhouse gases to the air
(in kg) Characterization model the model
developed by the IPCC defining the global
warming potential of different gases Category
indicator Infrared radiative forcing
(W/m2) Characterization factor Global warming
potential for a 100-year time horizon
(GWP100) for each GHG emission to the air
(in kg CO2 equivalents/kg emission) Unit of
indicator result kg (CO2 eq)
Substance GWP100 (in kg CO2 equivalents/kg
emission) Carbon dioxide 1 Methane 21 CFC-11
4000 CFC-13 11700 HCFC-123 93 HCFC-142b 2000 P
erfluoroethane 9200 Perfluoromethane 6500 Sulphu
r hexafluoride 23900
Source (Guinée et al., 2002)
5
Impact AssessmentClassification and
characterization Example 2
Impact category Stratospheric ozone
depletion LCI results Emissions of ozone
depleting gases to the air (in kg) Characterizatio
n model The model developed by WMO, defining the
ozone depletion potential of different
gases Category indicator Stratospheric ozone
breakdown Characterization factor Ozone depletion
potential in the steady state (ODP8) for each
emission (in kg CFC-11 equivalents/kg
emission) Unit of indicator result kg (CFC-11 eq)
Substance ODP8 (in kg CFC-11 equivalents/kg
emission) Halon-1301 12 Halon-1211 5.11 Halon-12
02 1.25 Tetrachloromethane 1.2 CFC-11 1 CFC-12
0.82 HCFC-123 0.012 HFC-142b 0.043 Methyl
Bromide 0.37
Source (Guinée et al., 2002)
6
Impact AssessmentClassification and
characterization Example 3
Impact category Acidification LCI
results Emissions of acidifying substances to
the air (in kg) Characterization model RAINS10
model, developed by IIASA, describing the fate
and deposition of acidifying substances,
adapted to LCA Category indicator Deposition/acidi
fication critical load Characterization
factor Acidification potential (AP) for each
acidifying emission to the air (in kg SO2
equivalents/kg emission) Unit of indicator
result kg (SO2 eq)
Substance AP (in kg SO2 equivalents/kg
emission) ammonia 1.88 hydrogen
chloride 0.88 hydrogen fluoride 1.60 hydrogen
sulfide 1.88 nitric acid 0.51 Nitrogen
dioxide 0.70 Nitrogen monoxide 1.07 Sulfur
dioxide 1.00 Sulphuric acid 0.65
Source (Guinée et al., 2002)
7
Impact AssessmentNormalization Weighting
The objective of normalization and weighting in
LCA is to present the environmental impacts of
the system under analysis in a form that is
useful for the purpose of the studyand that can
be understood by the users of the study
results. Normalization can be done in relation
to the annual output of a defined geographical
area, to an average persons annual
contribution, to the impacts caused by familiar
products or activities, etc.. Weighting requires
value judgments of the relative importance of
the used impact categories. This can NOT be done
based on natural science. It is similar to
valuation in environmental economics.
8
Life Cycle Impact AssessmentExample
9
Normalization
Normalization can be done in relation to the
annual output of a defined geographical area, to
an average persons annual contribution, to the
impacts caused by familiar products or
activities.
Indicator results
82kg CO2 eq
0.005kg CFC-11 eq
0.068kg ethylene eq
2.4kg SO2 eq
10
Life cycle inventory
Indicator results
Normalized indicator results
11
Weighting
Weighting requires value judgments of the
relative importance of the used impact
categories. This can NOT be done based on natural
science. It is similar to valuation in
environmental economics.
Normalized indicator results
Weights
4
x
0.4
10
1
x
0.5
50
3
x
0.6
20
2
x
1.4
70
Score
2.9
12
Impact Assessment in matrix notation
Normalized indicator results
Life cycle inventory
Score
Weights
Indicator results
Characterization Factors
13
Impact AssessmentSummary
- At present, there is no agreement on one
standard format for LCIA. - ISO14042 contains guidelines and recommendation
for LCIA. - According to ISO14042, mandatory elements of
LCIAs are impact categories, classification and
characterization. - The terminology used in this introduction is
based on ISO14042. - Popular problem-oriented (midpoint) methods are
CML indicators, developed in The Netherlands,
and TRACI, developed by the US EPA. - Other currently used LCIA methods include
damage-oriented (endpoint) methods, like EPS
and Eco-Indicator99 (both Dutch), and
distance-to-target methods like the Critical
Volumes approach of BUWAL, the Swiss EPA. - All examples in this introduction are based on
the problem oriented approach - Normalization is generally recommended and helps
to better understand the relative importance
and magnitude of the indicator results. - Weighting and valuation are much debated and
ISO14042 explicitly mentions that they are
based on value choices and not on natural
sciences.
14
Goal and scopedefinition
Interpretation
Inventoryanalysis
Impactassessment
15
Interpretation
- Life Cycle Interpretation is the phase in which
the results of the study and all choicesand
assumptions made during its course are evaluated
in terms of soundness and robustness, and
overall conclusions are drawn and recommendations
made. - ISO14044 distinguishes between three different
elements - Identification of significant issues based on
LCI and LCIA results - Completeness, sensitivity and consistency checks
- Conclusions, limitation and recommendations
- One of the main aims of Interpretation is to
check the results of Inventory Analysis and
Impact assessment against the Goal and Scope
Definition of the study.
16
Interpretation Identification of significant
issues based on LCI and LCIA results
- Significant inventory data such as energy,
emissions, waste, etc. - Significant impact categories such as resource
use, climate change, toxicity, etc. - Significant contribution from life cycle stages
such as individual unit processes or whole
process groups (e.g. use phase)
Typical life cycle GHG emissions of an ICE
passenger car
17
Interpretation Completeness, sensitivity and
consistency checks
- Completeness check makes sure that nothing
important or relevant has been left out (e.g.
through cut-off, data gaps or missing impact
category). Relevance of missing elements with
respect to goal and scope of study needs to
be discussed - Sensitivity and uncertainty analysis studies
the effect of variations in process data,
boundary, allocation and modeling choices and
other variables. The objective is to assess the
reliability and robustness of the LCI and CLIA
results. - Consistency check determines whether the
assumptions, methods, models and data are
consistent with goal and scope of the LCA
study and with each other. Examples are
consistency in - data quality along a product
life cycle or between different product systems
- regional and temporal aspects - allocation
rules and system boundaries - impact assessment
18
Interpretation Conclusions, limitation and
recommendations
- Conclusions are based on the significant
findings and their robustness. - Limitations are based the completeness,
sensitivity and consistency checks. - Recommendations are based on the conclusions
and their limitations.
- ISO 14044 also provides guidelines on
- how to report of LCA studies
- how to conduct a critical review of an LCA study
Critical reviews by external experts or panels on
interested parties are especially important if
the LCA study is intended to be used for a
comparative assertion intended to be disclosed to
the public.
Recommended
CrystalGraphics Presentations


