
Mitochondrial DNA - PowerPoint PPT Presentation
1 / 20
Title:
Mitochondrial DNA
Description:
Mitochondrial DNA. Observations on Frye/Daubert Issues Associated with Forensic mtDNA Typing. ... Amplified DNA samples from a variety of donors were mixed in ... – PowerPoint PPT presentation
Number of Views:325
Avg rating:3.0/5.0
Title: Mitochondrial DNA
1
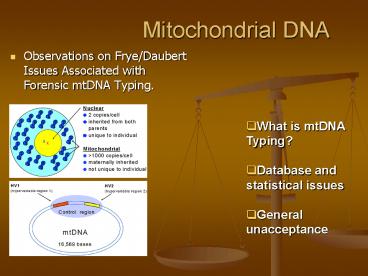
Mitochondrial DNA
- Observations on Frye/Daubert Issues Associated
with Forensic mtDNA Typing.
- What is mtDNA Typing?
- Database and statistical issues
- General unacceptance
2
VALIDATION OF LABORATORY CONTAMINATION
Because of the sensitivity of this method.
The issue of detection and quantitation of
external contamination is important. We have
observed low levels of amplified product in
negative controls and reagent blanks when
amplifying human mtDNA. (Wilson et al., 1995a,
p 667). Previously sequenced amplicons were
quantified by CE and two samples with different
mtDNA control region sequences were chosen for
this study. Amplified DNA was mixed together
from the two samples in ratios of 41, 81, 121
and 161. Sequencing reactions were performed on
the mixtures as previously described. Editing of
the analyzed data from the sequence of the mixed
samples was conducted by two individuals.
Ambiguous bases (bases which could not be
designated) and errors (bases which were called
incorrectly) were noted. In the 41 mixture,
both ambiguities and errors were observed. The
81 mixture yielded only two ambiguous calls from
both editors at positions that differed in
sequence between the mixed templates. No errors
or ambiguities were noted at the 81 mixture. All
base calls were completely consistent with the
more abundant sequence at and above 81. (Wilson
et al., 1995a, p 667).
3
LABORATORY CONTAMINATION, CONT. In order to
confirm that correct typing results can be
achieved using this ratio, additional tests were
conducted. Amplified DNA samples from a variety
of donors were mixed in 101 ratios with other
amplified DNAs. The dominant and minor samples
were blindly reversed to the sequence editors.
At the 101 ratio in a total of five such tests,
all of the base calls from both editors were
consistent with the known sequence of the more
abundant sample with no errors or ambiguous
calls. (Wilson et al., 1995a, p 668).
4
(No Transcript)
5
SEQUENCE FREQUENCY
- Unless the discriminatory potential of a test
can be objectively evaluated, an inclusion could
mean anything. It is therefore incumbent on the
forensic scientist to determine a means to
evaluate and communicate the significance of an
mtDNA inclusion or match. Holland Parsons,
1999. Forens. Sci. Intl.
6
Group Profiles
African origin 1332
Caucasian origin 1674
Hispanic origin 686
Asian origin 821
Native American origin 326
Total 4839
7
Database Profiles
African-American 1148
Sierra Leone 109
Caucasian 1655
Hispanic 686
Japan 163
Korea 182
Thailand 52
Navajo 146
Apache 180
Egypt 75
China/Taiwan 329
Guam 87
8
(No Transcript)
9
(No Transcript)
10
(No Transcript)
11
(No Transcript)
12
Native American Comparisons
13
(No Transcript)
14
Asian Comparisons
15
African Pacific Group Comparisons
16
Overall Search Results within Forensic Profiles
Number of DifferencesFrom Search Profile Number Frequency CumulativeNumber CumulativeFrequency
0 151 0.0365 151 0.0365
1 332 0.0802 483 0.1166
2 277 0.0669 760 0.1835
3 215 0.0519 975 0.2354
4 266 0.0642 1241 0.2996
5 436 0.1053 1677 0.4049
gt 5 2465 0.5951 4142 1.0000
Average Number of Differences 6.681
17
African Origin Database(s) within Forensic
Profiles
Number of DifferencesFrom Search Profile Number Frequency CumulativeNumber CumulativeFrequency
0 5 0.0054 5 0.0054
1 8 0.0086 13 0.0140
2 8 0.0086 21 0.0226
3 8 0.0086 29 0.0313
4 34 0.0366 63 0.0679
5 69 0.0744 132 0.1422
gt 5 796 0.8578 928 1.0000
Average Number of Differences 9.881
18
Caucasian Origin Database(s) within Forensic
Profiles
Number of DifferencesFrom Search Profile Number Frequency CumulativeNumber CumulativeFrequency
0 141 0.0795 141 0.0795
1 296 0.1669 437 0.2465
2 243 0.1371 680 0.3835
3 167 0.0942 847 0.4777
4 158 0.0891 1005 0.5668
5 219 0.1235 1224 0.6904
gt 5 549 0.3096 1773 1.0000
Average Number of Differences 4.111
19
A 95 Upper Confidence Interval Using the Normal
Approximation of the Binomial
P ? 1.96 PQ/N1/2 where P X/N, Q 1-P, N
Database Size, and X number of times a
matching sequence is found in the
database. Frequency of 0 differences
9.2 Frequency of 1 difference 27.2
20
CONFIDENCE LIMIT FROM ZERO PROPORTION
P limit 1 a 1/N, where N Database
Size
N Maximum Frequency
50 0.058 1 in 17 100 0.030 1
in 34 200 0.015 1 in
67 500 0.006 1 in 167 1000 0.003
1 in 334 5000 0.0006 1 in 1670
Recommended
CrystalGraphics Presentations


